Bitcoin’s lower lows worry traders — But is the BTC bull market really in danger?

Bitcoin’s (BTC) price has seen massive gains in recent months as the price of Bitcoin accelerated from $11,000 to nearly $62,000. However, such impressive rallies also include relatively calm periods of price action.
These periods are consolidative and are needed for the market to find a new floor. In bull markets, bullish continuation is likely after these periods of ranging before another leg up can happen.
Currently, Bitcoin’s price seems to be in such a period just over a week after hitting all-time highs above $61,000.
$53K level has to hold to avoid more downside
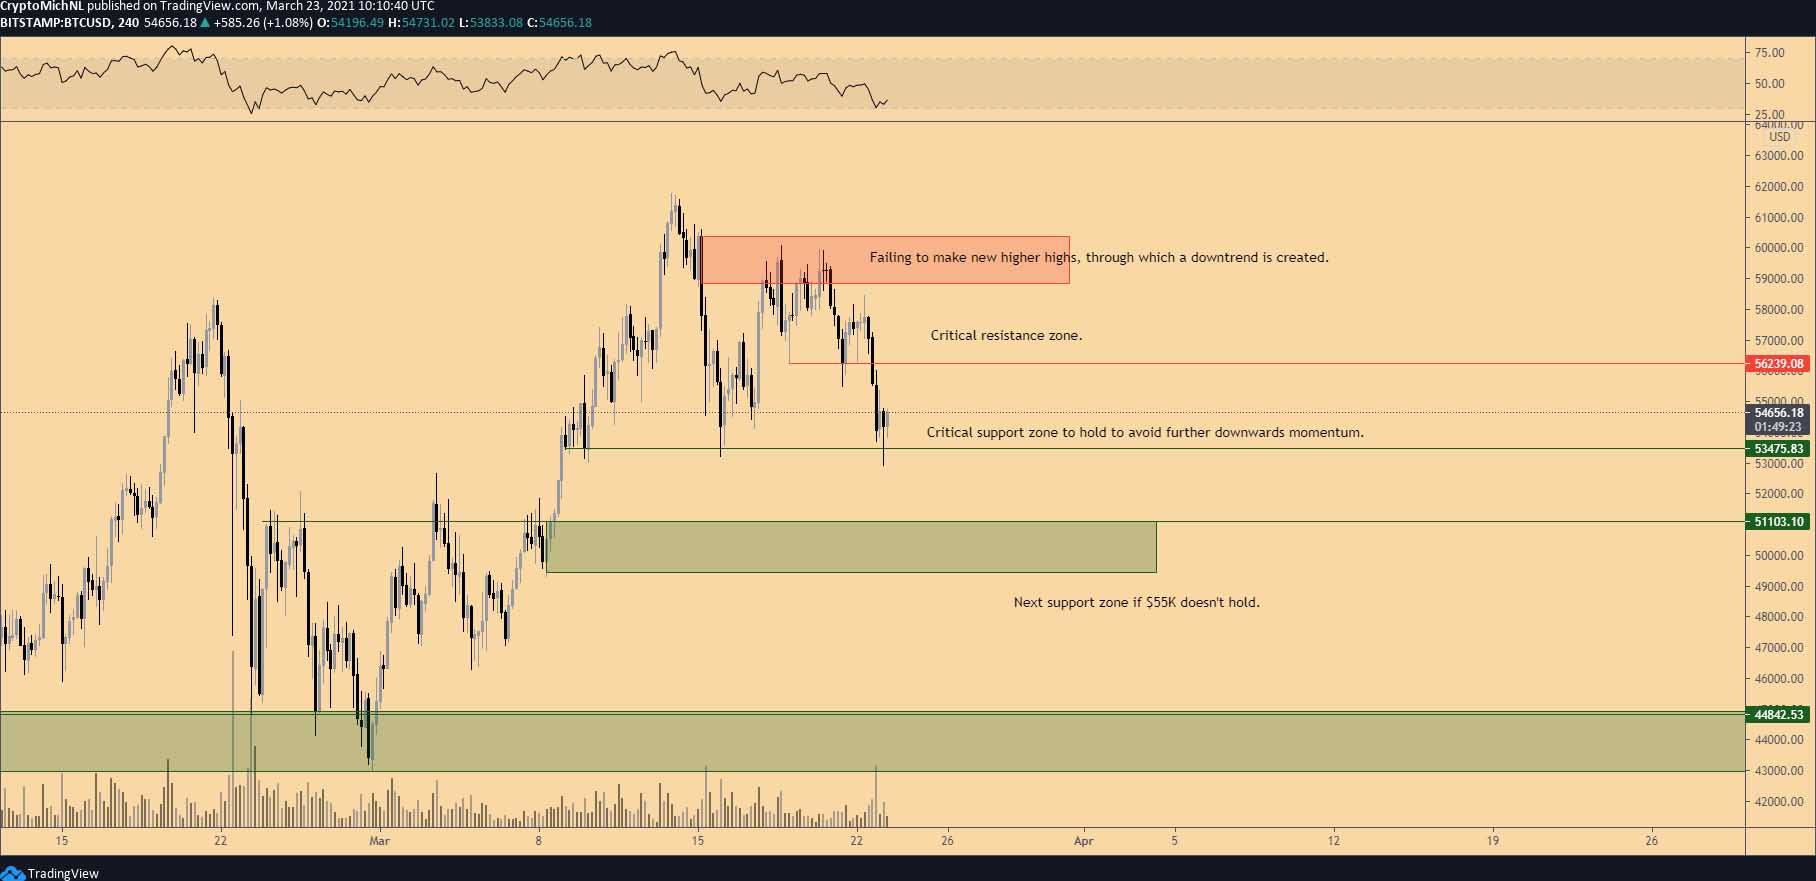
BTC/USD 4-hour chart. Source: TradingView
The 4-hour chart for BTC/USD shows a clear downtrend since its recent all-time high in mid-March. This happened after a breakthrough past $58,000. However, this move showed weakness as there wasn’t any sign of new buyers stepping in for more upside.
In other words, a bullish strength would be demonstrated with an increase in volume, which didn’t happen. Therefore, a correction back to $50,000 is a very normal and healthy occurrence for this market.
Moreover, the chart shows a short-term downtrend in which lower highs and lower lows are being constructed. In this regard, Bitcoin’s price landed on the $53,000 support zone, which can be classified as the critical support zone to hold.
If this $53,000 support doesn’t hold, a further correction towards $49,000-50,800 is inevitable, and the markets are going to see more blood.
On the other hand, if the $53,000 area holds, Bitcoin’s price has to break through the $56,200 area to generate strength once again. In that regard, the $56,200 area can be considered as the critical resistance zone to break at the moment.
Nevertheless, even if $56,200 breaks, there are still other resistances remaining overhead before Bitcoin’s price can aim for new all-time highs.
Daily timeframe shows massive bull cycle
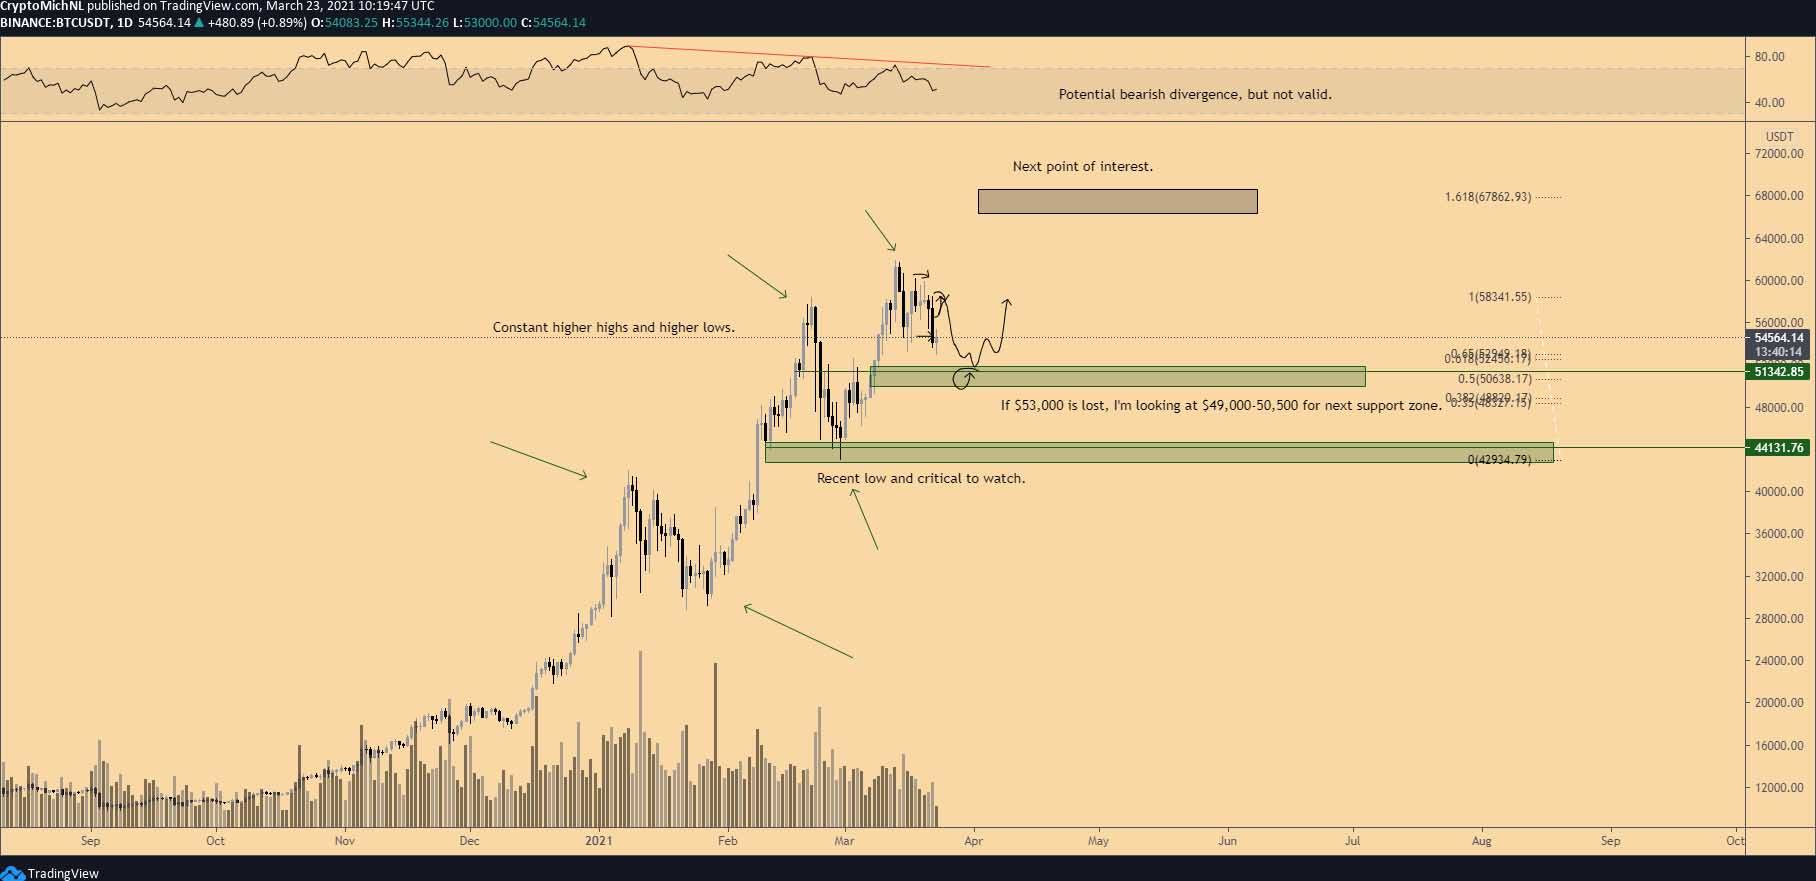
BTC/USDT 1-day chart. Source: TradingView
The daily chart for Bitcoin shows an apparent bullish cycle that’s constantly making higher highs and higher lows. Traders and investors should always zoom out to avoid any confusion regarding the overall trend. Simply put, the price action of Bitcoin is still bullish.
Therefore, a correction to the $50,000 area would still be very normal — if not expected — as the $50,000 area is a massive support zone.
Even if Bitcoin’s price corrects further to the $44,000 area, the bullish construction is still valid as these sideways ranges have been happening quite often since breaking the 2017 all-time high.
As long as Bitcoin stays above $44,000 and preferably $50,000, the bearish divergence will become invalid, as history has shown multiple examples of this.
Similar construction seen after the halving in 2020
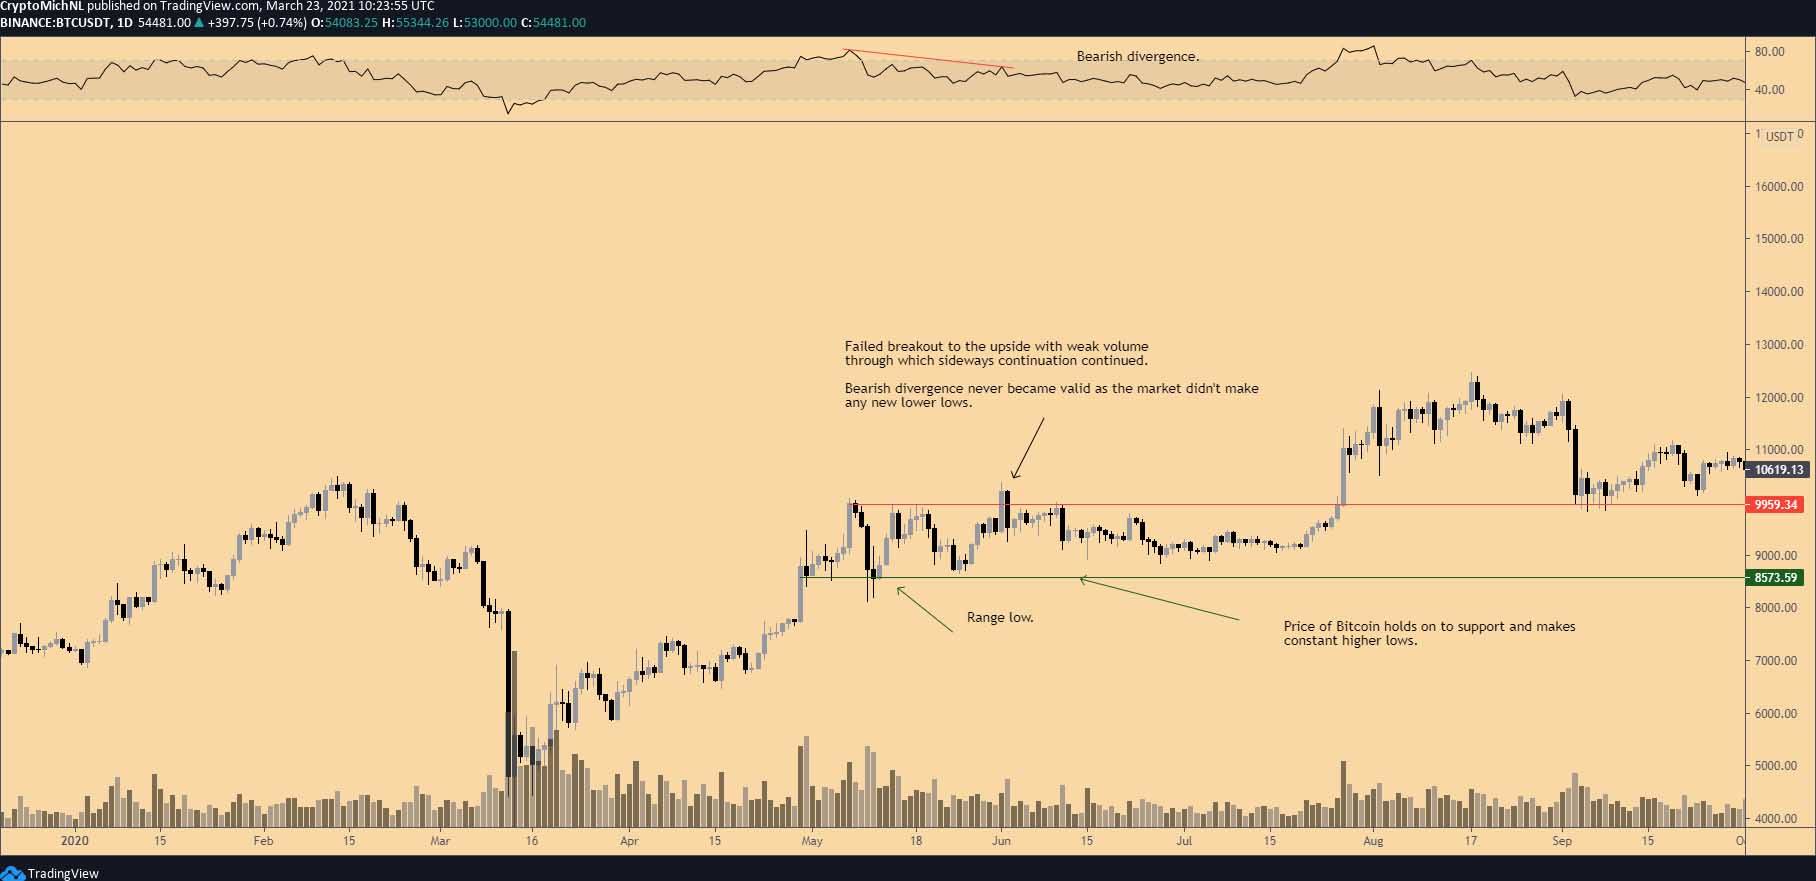
BTC/USDT 1-day chart. Source: TradingView
The chart construction after the halving of May 2020 looks identical to the recent price action of Bitcoin. In that sense, a failed breakout doesn’t guarantee that a bear market is imminent.
Bulls should be patient as a new floor may be established for Bitcoin’s price. After this compression and construction, a new impulse wave can happen once again, as seen in August of 2020. In that period, Bitcoin’s price accelerated from $9,500 to $12,000.
The chart above shows the invalidation of the bearish divergence as new lower lows did not occur. The current price action could be painting a similar picture, in which a bottom has to be made between $44,000 and $50,000 to avoid new lower lows. If that happens, Bitcoin’s price will invalidate the bearish divergences and the bull market will continue.
Author

Cointelegraph Team
Cointelegraph
We are privileged enough to work with the best and brightest in Bitcoin.


