Bitcoin’s bullish price action continues to bolster rallies in FIL, OKB, VET and RPL

BTC’s shallow correction near the $25,000 level could lead to dip buying in FIL, OKB, VET and RPL.
The Dow Jones Industrial Average fell for the third consecutive week but Bitcoin price decoupled and is on track to close the week near the strong overhead resistance at $25,211. This suggests that the wider crypto market recovery is on a strong footing.
After Bitcoin’s sharp rally from the lows, analysts remain divided in their opinion about the next move. Some traders believe that the current Bitcoin rally will turn down once again, but others expect the momentum to continue, indicating the start of a new bull phase.
Chances are that Bitcoin and several other cryptocurrencies may continue to rally until a vast majority of the bears turn bullish. After that happens, a sizable dip is likely. That could shake out several weak hands and give an opportunity to the stronger hands to add to their positions. A higher low followed by a higher high may confirm the end of the bear phase and signal the start of the next bull market.
Meanwhile, select altcoins are looking strong and they may follow Bitcoin higher in the near term.
Let’s look at the charts to determine the critical levels to keep an eye on.
BTC/USDT
Bitcoin is trading near the stiff overhead resistance at $25,211. The small trading range days on Feb. 18 and Feb. 19 indicate that bulls are not hurrying to book profits and the bears are wary of shorting at the current levels.
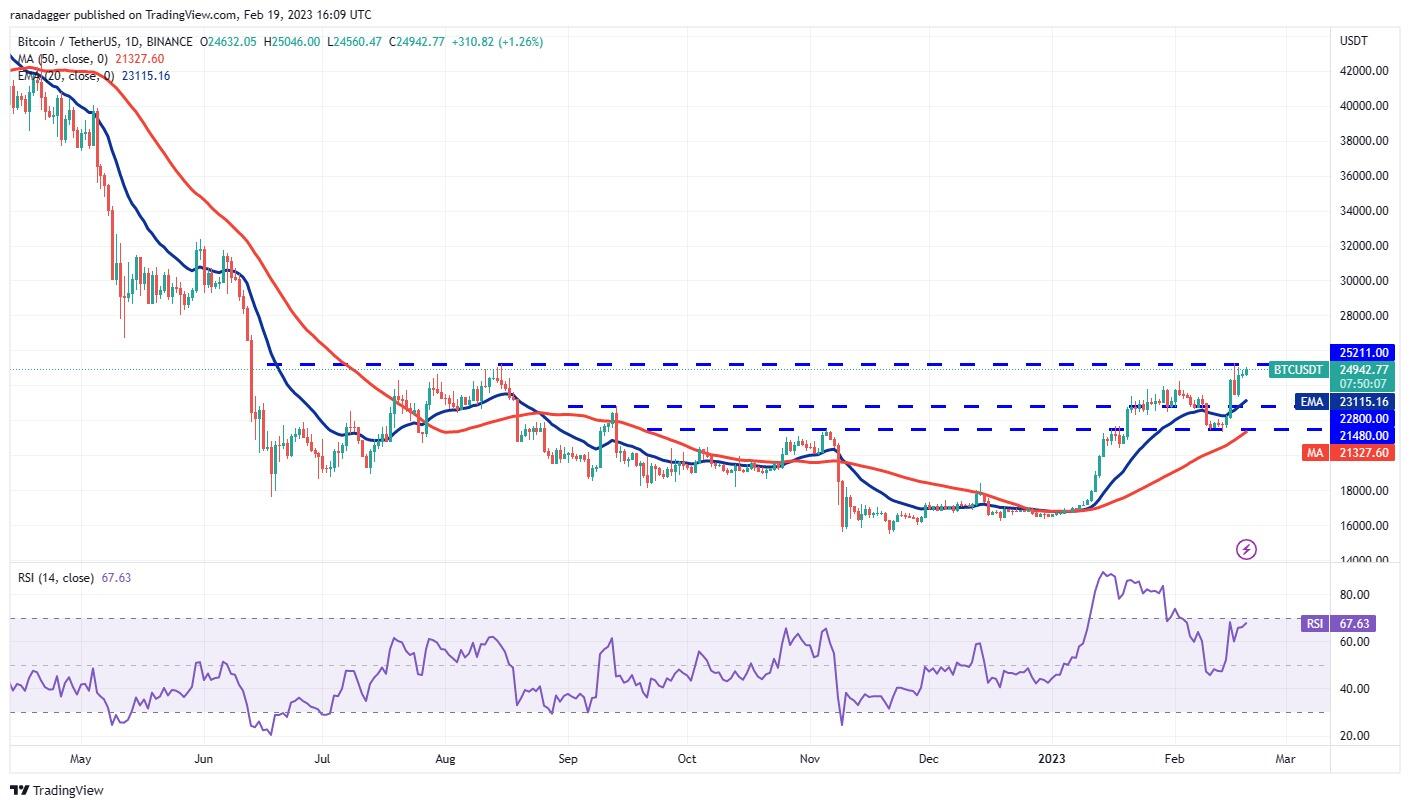
BTC/USDT daily chart. Source: TradingView
The upsloping moving averages and the relative strength index (RSI) near the overbought territory indicate that bulls are firmly in command. A tight consolidation near a stiff overhead resistance usually resolves to the upside. If buyers catapult the price above $25,250, the BTC/USDT pair could accelerate to $31,000 as there is no major resistance in between.
Conversely, if the price dumps from the current level, it could find support at the 20-day exponential moving average ($23,115). The bears will have to pull the price below $22,800 to break the bullish momentum. The pair may then collapse to $21,480, which is likely to act as a strong support.

BTC/USDT 4-hour chart. Source: TradingView
The bears aggressively sold the rally to $25,250 but they could not tug the price below the 20-EMA. This suggests that the sentiment remains strong and the bulls are viewing the dips as a buying opportunity.
Buyers are likely to have another go at the overhead resistance. If they manage to drive the price above $25,250, the next leg of the uptrend could begin.
The first sign of weakness will be a break below the 20-EMA. That will embolden the bears who will then try to sink the price to $22,800.
FIL/USDT
Filecoin soared above the immediate resistance level of $7 on Feb. 17. This shows the intention of the bulls to start a new up-move.
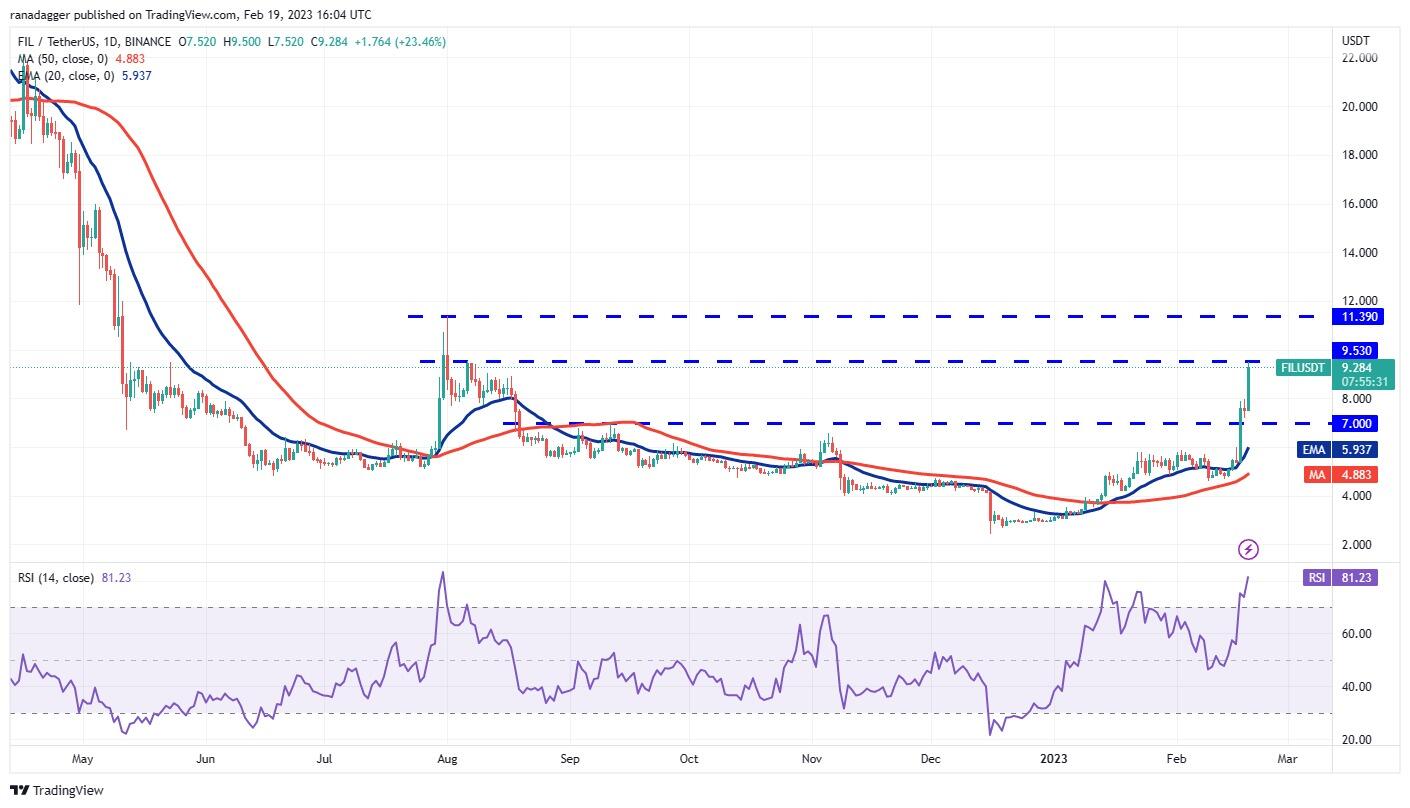
FIL/USDT daily chart. Source: TradingView
After a brief consolidation on Feb. 18, the bulls continued the up-move on Feb. 19. This strong rally indicates aggressive buying by the bulls. There is a minor resistance at $9.53 but that is likely to be crossed.
The FIL/USDT pair could then take aim at $11.39. This level is likely to act as a major obstacle, but if bulls do not allow the next pullback to dip back below $9.53, the uptrend may continue. The next resistance is at $16.
This positive view could negate in the near term if the price turns down from the current level and plummets below $7.
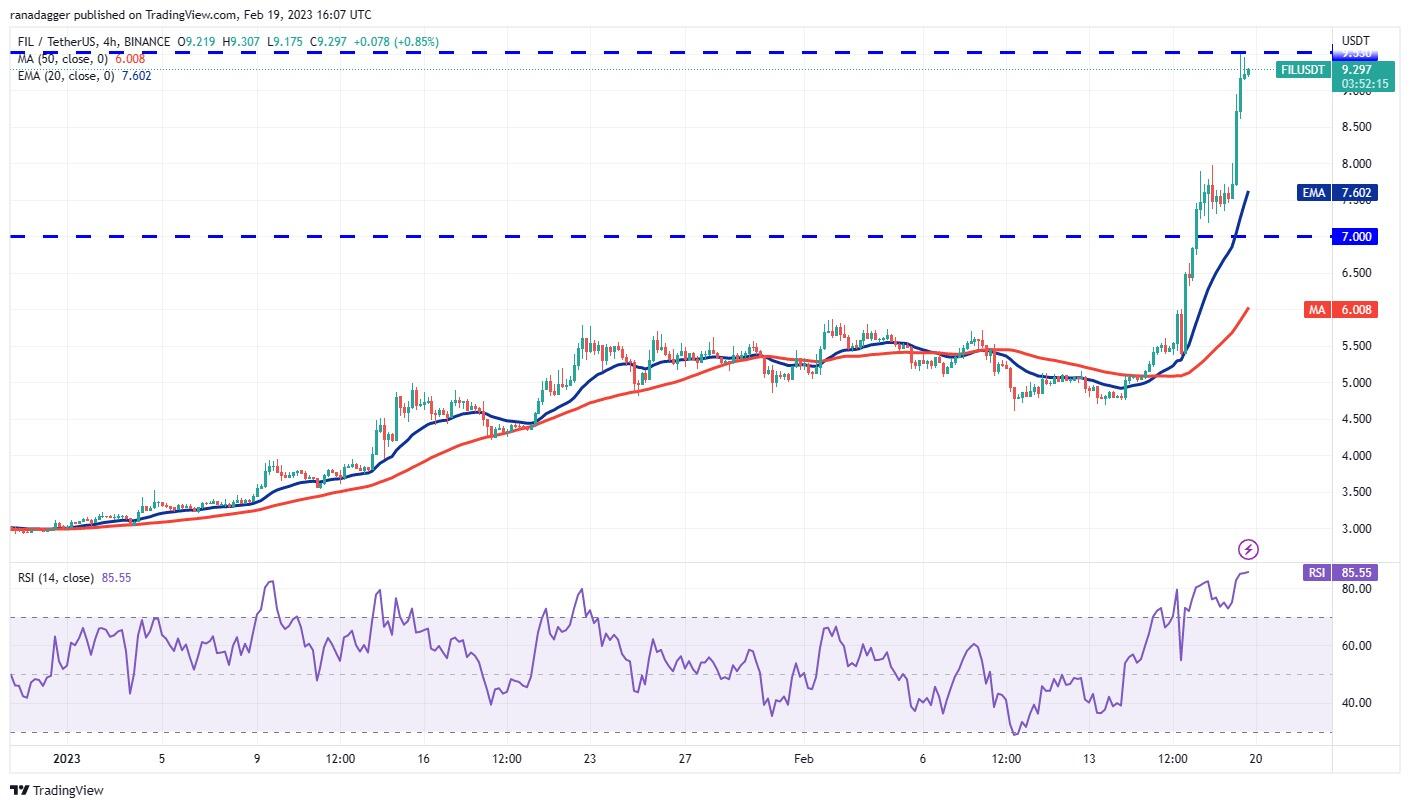
FIL/USDT 4-hour chart. Source: TradingView
The 4-hour chart shows that the bears tried to stall the up-move at $8 but the bulls did not allow the price to slip back below the breakout level of $7. This indicates aggressive buying on every minor dip. The rally picked up pace and reached the overhead resistance at $9.53.
Sellers may mount a strong defense at this level but the upsloping 20-EMA and the RSI in the overbought zone indicate that the path of least resistance is to the upside. If bears want to stop the rally, they will have to yank the price back below $8.
OKB/USDT
While most cryptocurrencies are languishing far below their all-time high, OKB (OKB) has been consistently hitting a new high for the past few days. Any asset that hits a new all-time high denotes strength.
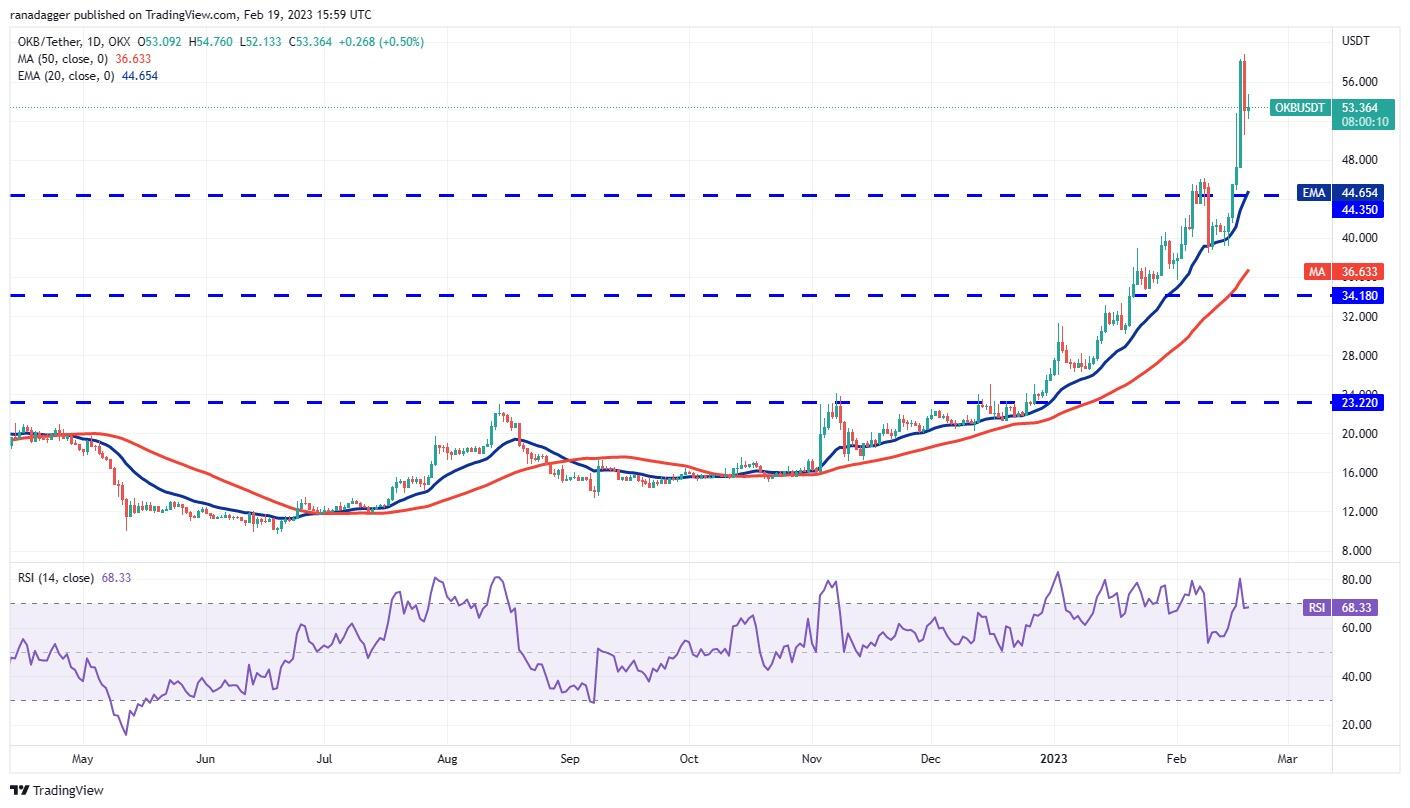
OKB/USDT daily chart. Source: TradingView
The OKB/USDT pair turned down on Feb. 18, indicating profit booking above $58. In a strong uptrend, corrections usually do not last for more than three to five days. If the price turns up from $50, the bulls will try to propel the pair above $59. If they succeed, the pair could start its journey toward $70.
Another possibility is that the pair corrects sharply and retests the support at $45. If buyers flip this level into support, the pair may consolidate between $45 and $58 for a few days. The bears will have to sink the price below $44 to gain the upper hand.

OKB/USDT 4-hour chart. Source: TradingView
The 4-hour chart shows that buyers bought the dip to the 20-EMA but the rebound lacks strength. Although the moving averages are sloping up, the RSI is showing a negative divergence. This indicates a weakening bullish momentum. If the 20-EMA cracks, the pair could slide to $47.50 and then to $44.35.
Alternatively, if the price turns up and breaks above $55, the bulls may have another go at the all-time high at $58.84. If this level is cleared, the pair may resume its uptrend.
VET/USDT
VeChain successfully held the retest of the downtrend line and thereafter broke above the overhead resistance, indicating that the bears may be losing their grip.
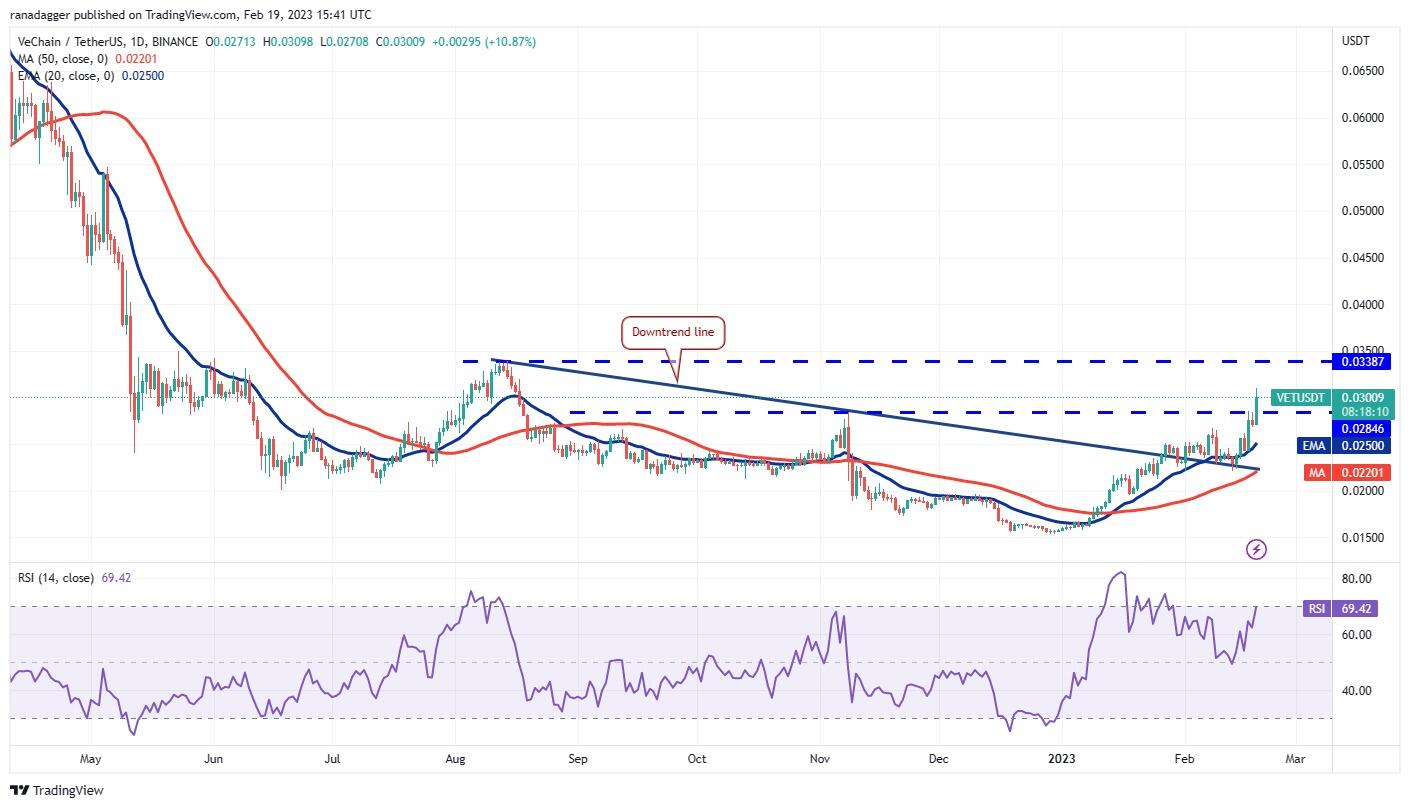
VET/USDT daily chart. Source: TradingView
The moving averages have turned up and the RSI is near the overbought zone. This suggests that bulls have the upper hand. If buyers flip the $0.028 level into support during the next pullback, the VET/USDT pair may surge toward the next overhead resistance at $0.034.
Buyers are expected to protect this level with vigor because a break above it could indicate the start of a new uptrend. The pair may then rise to $0.05. This positive view could invalidate in the near term if the price turns down and plummets below the 20-day EMA ($0.025).
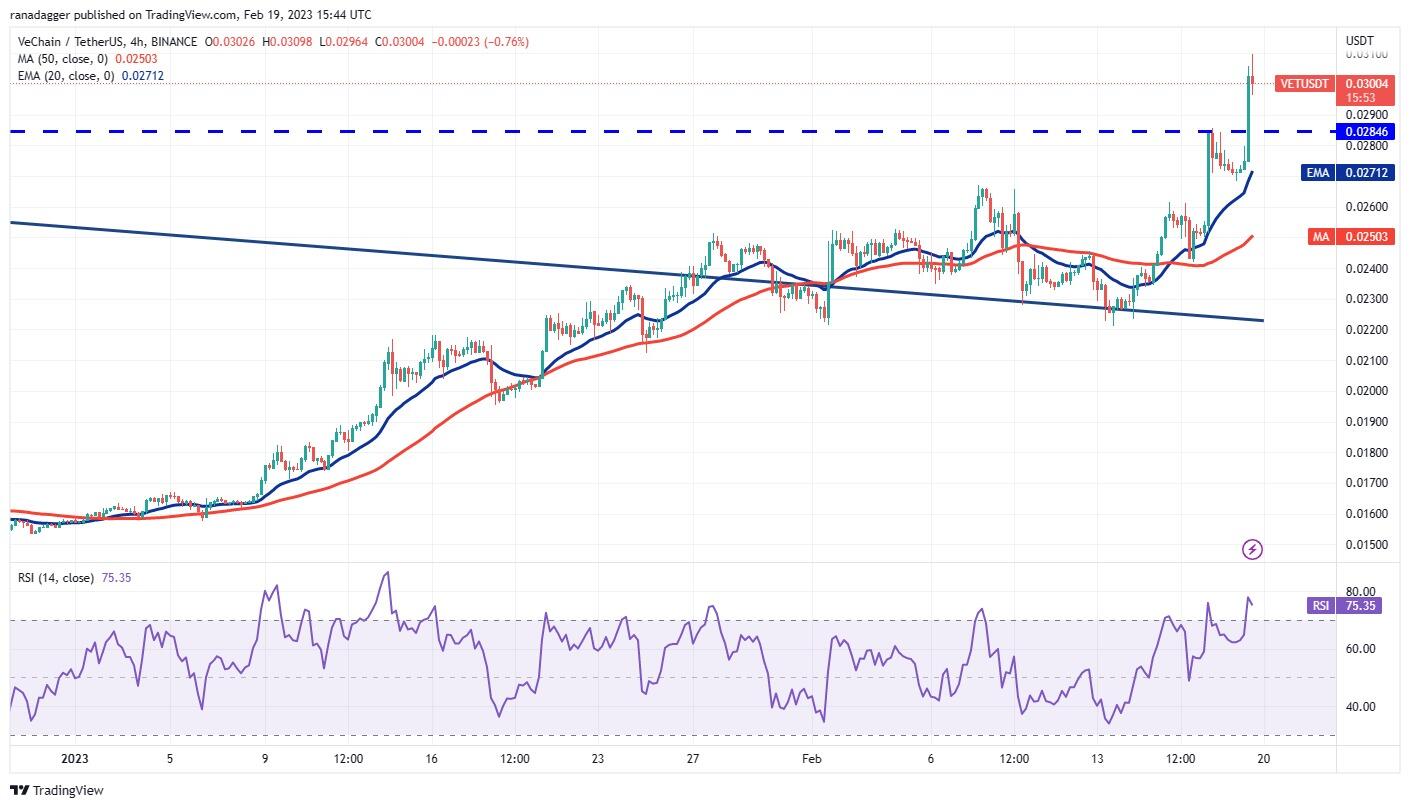
VET/USDT 4-hour chart. Source: TradingView
The 4-hour chart shows that the bulls kicked the price above the overhead resistance, indicating the start of the next leg of the up-move. If bulls sustain the price above the breakout level, the pair may pick up momentum and quickly rally to $0.032 and then to $0.034.
Contrarily, if the price turns down from the current level and breaks below the 20-EMA, several aggressive bulls may get trapped. That could start a deeper correction as longs bail out of their position. The pair may then slide to $0.022.
RPL/USDT
Rocket Pool (RPL) has been in an uptrend for the past few days. The price has not broken below the 20-day EMA ($45) during pullbacks, indicating strong demand to buy at lower levels.
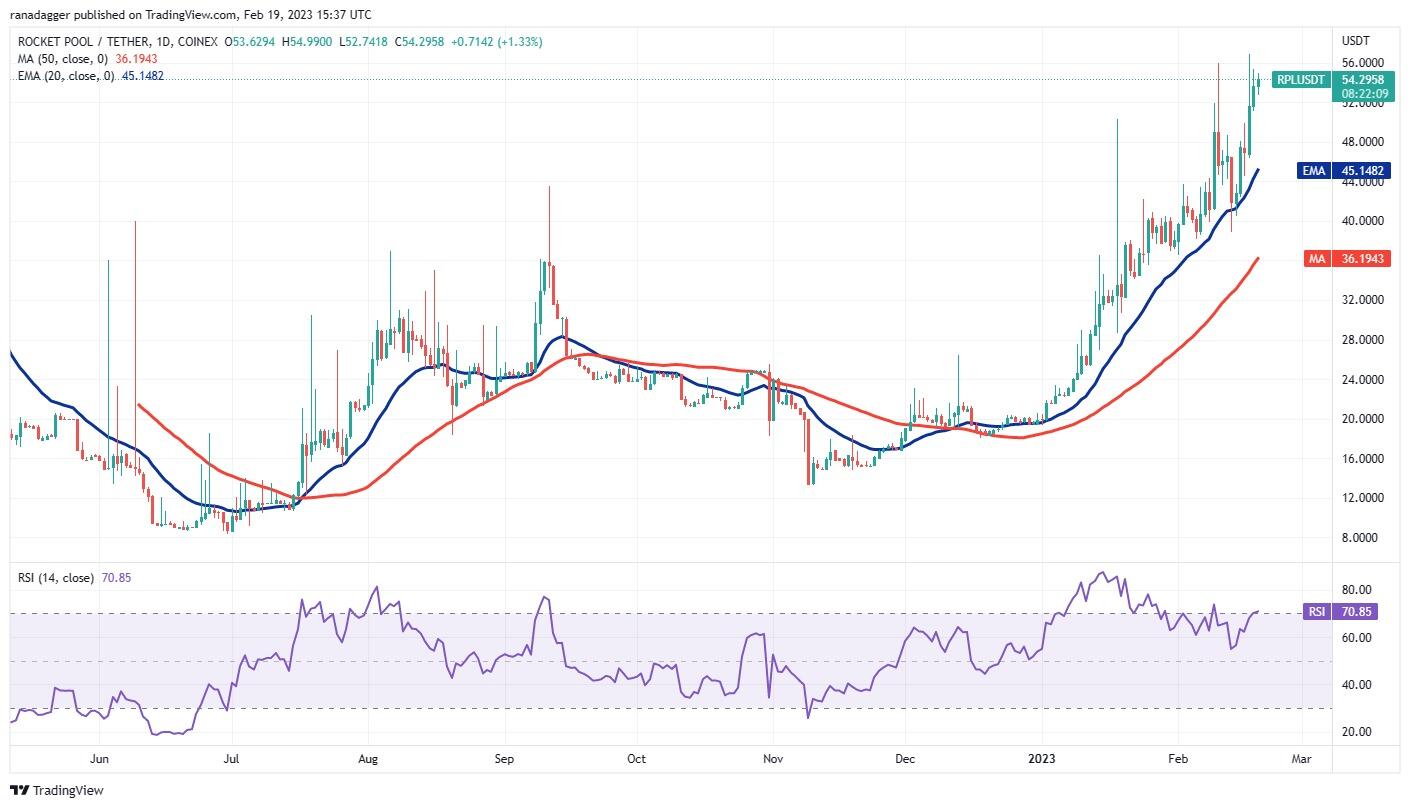
RPL/USDT daily chart. Source: TradingView
The inside-day candlestick pattern on Feb. 18 and 19 shows that bears are trying to stall the uptrend near $56 but the bulls are not willing to surrender their advantage. If buyers thrust the price above $57, the RPL/USDT could march toward the next target objective at $74.
On the downside, the first support is at the psychological level of $50. If this level gives way, the pair may slip toward the 20-day EMA ($45). This is an important level for the bulls to defend because a break below it may signal a trend change in the short term.
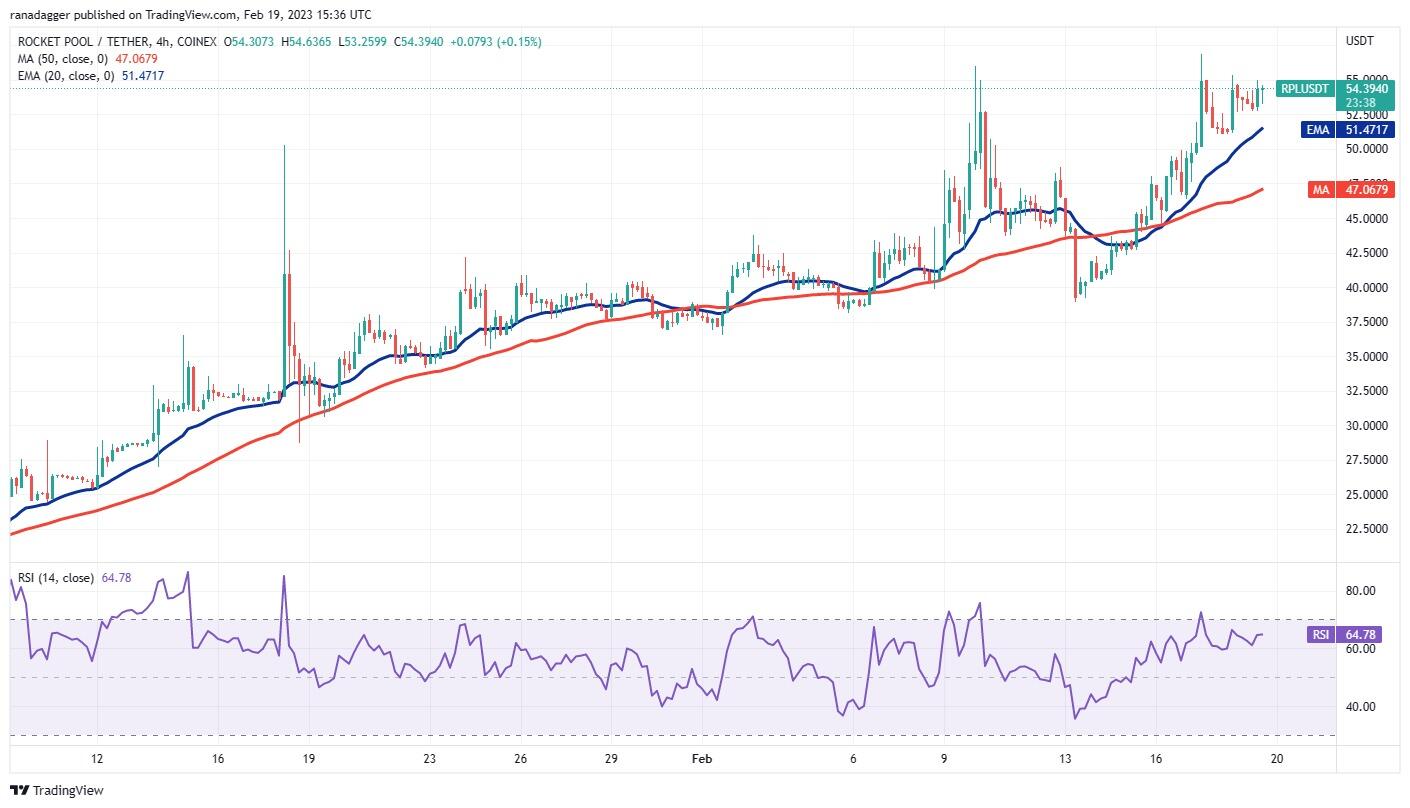
RPL/USDT 4-hour chart. Source: TradingView
The 4-hour chart shows that bears are trying to defend the $56 level but the bulls have not given up much ground. This suggests that buyers are holding on to their positions as they anticipate a break above the overhead resistance. If that happens, the pair could rise to $61 and thereafter to $74.
Contrary to this assumption, if the price turns down and breaks below the 20-EMA, it will suggest that the bulls have given up and are booking profits. That may result in a deeper correction to the 50-SMA and then to $38.
Author

Cointelegraph Team
Cointelegraph
We are privileged enough to work with the best and brightest in Bitcoin.


