Bitcoin Weekly Forecast: Will BTC take a break after $30,000?
- Bitcoin price remains bullish on the longer-term timeframes, eyeing a push up to $35,290.
- The three-day chart for BTC is starting to flip bullish and hints at an extension of the 2023 rally.
- On the daily variant, however, the big crypto might form a range and retrace to $28,545 before attempting a new leg up.

Bitcoin price remains highly bullish on all timeframes. The recent rally has pushed it to the $30,000 psychological level. With rising Bitcoin dominance, altcoins are likely going to be sidelined while investors pour capital into BTC, pushing the big crypto to scale higher heights.
Also read: Bitcoin dominance hits two-year high at 51%, jeopardizing altcoin gains
Bitcoin price from a weekly timeframe
Bitcoin price is currently hovering around the $30,000 region, with the weekend just around the corner. With a lack of trading volume, volatility is going to be absent. Additionally, the second quarter of 2023 is also coming to an end, which could potentially trigger a volatile move around the monthly close. But a question that many sidelined investors have is - “will there be a retracement?”
To answer this question, let us take a look at Bitcoin from multiple timeframes.
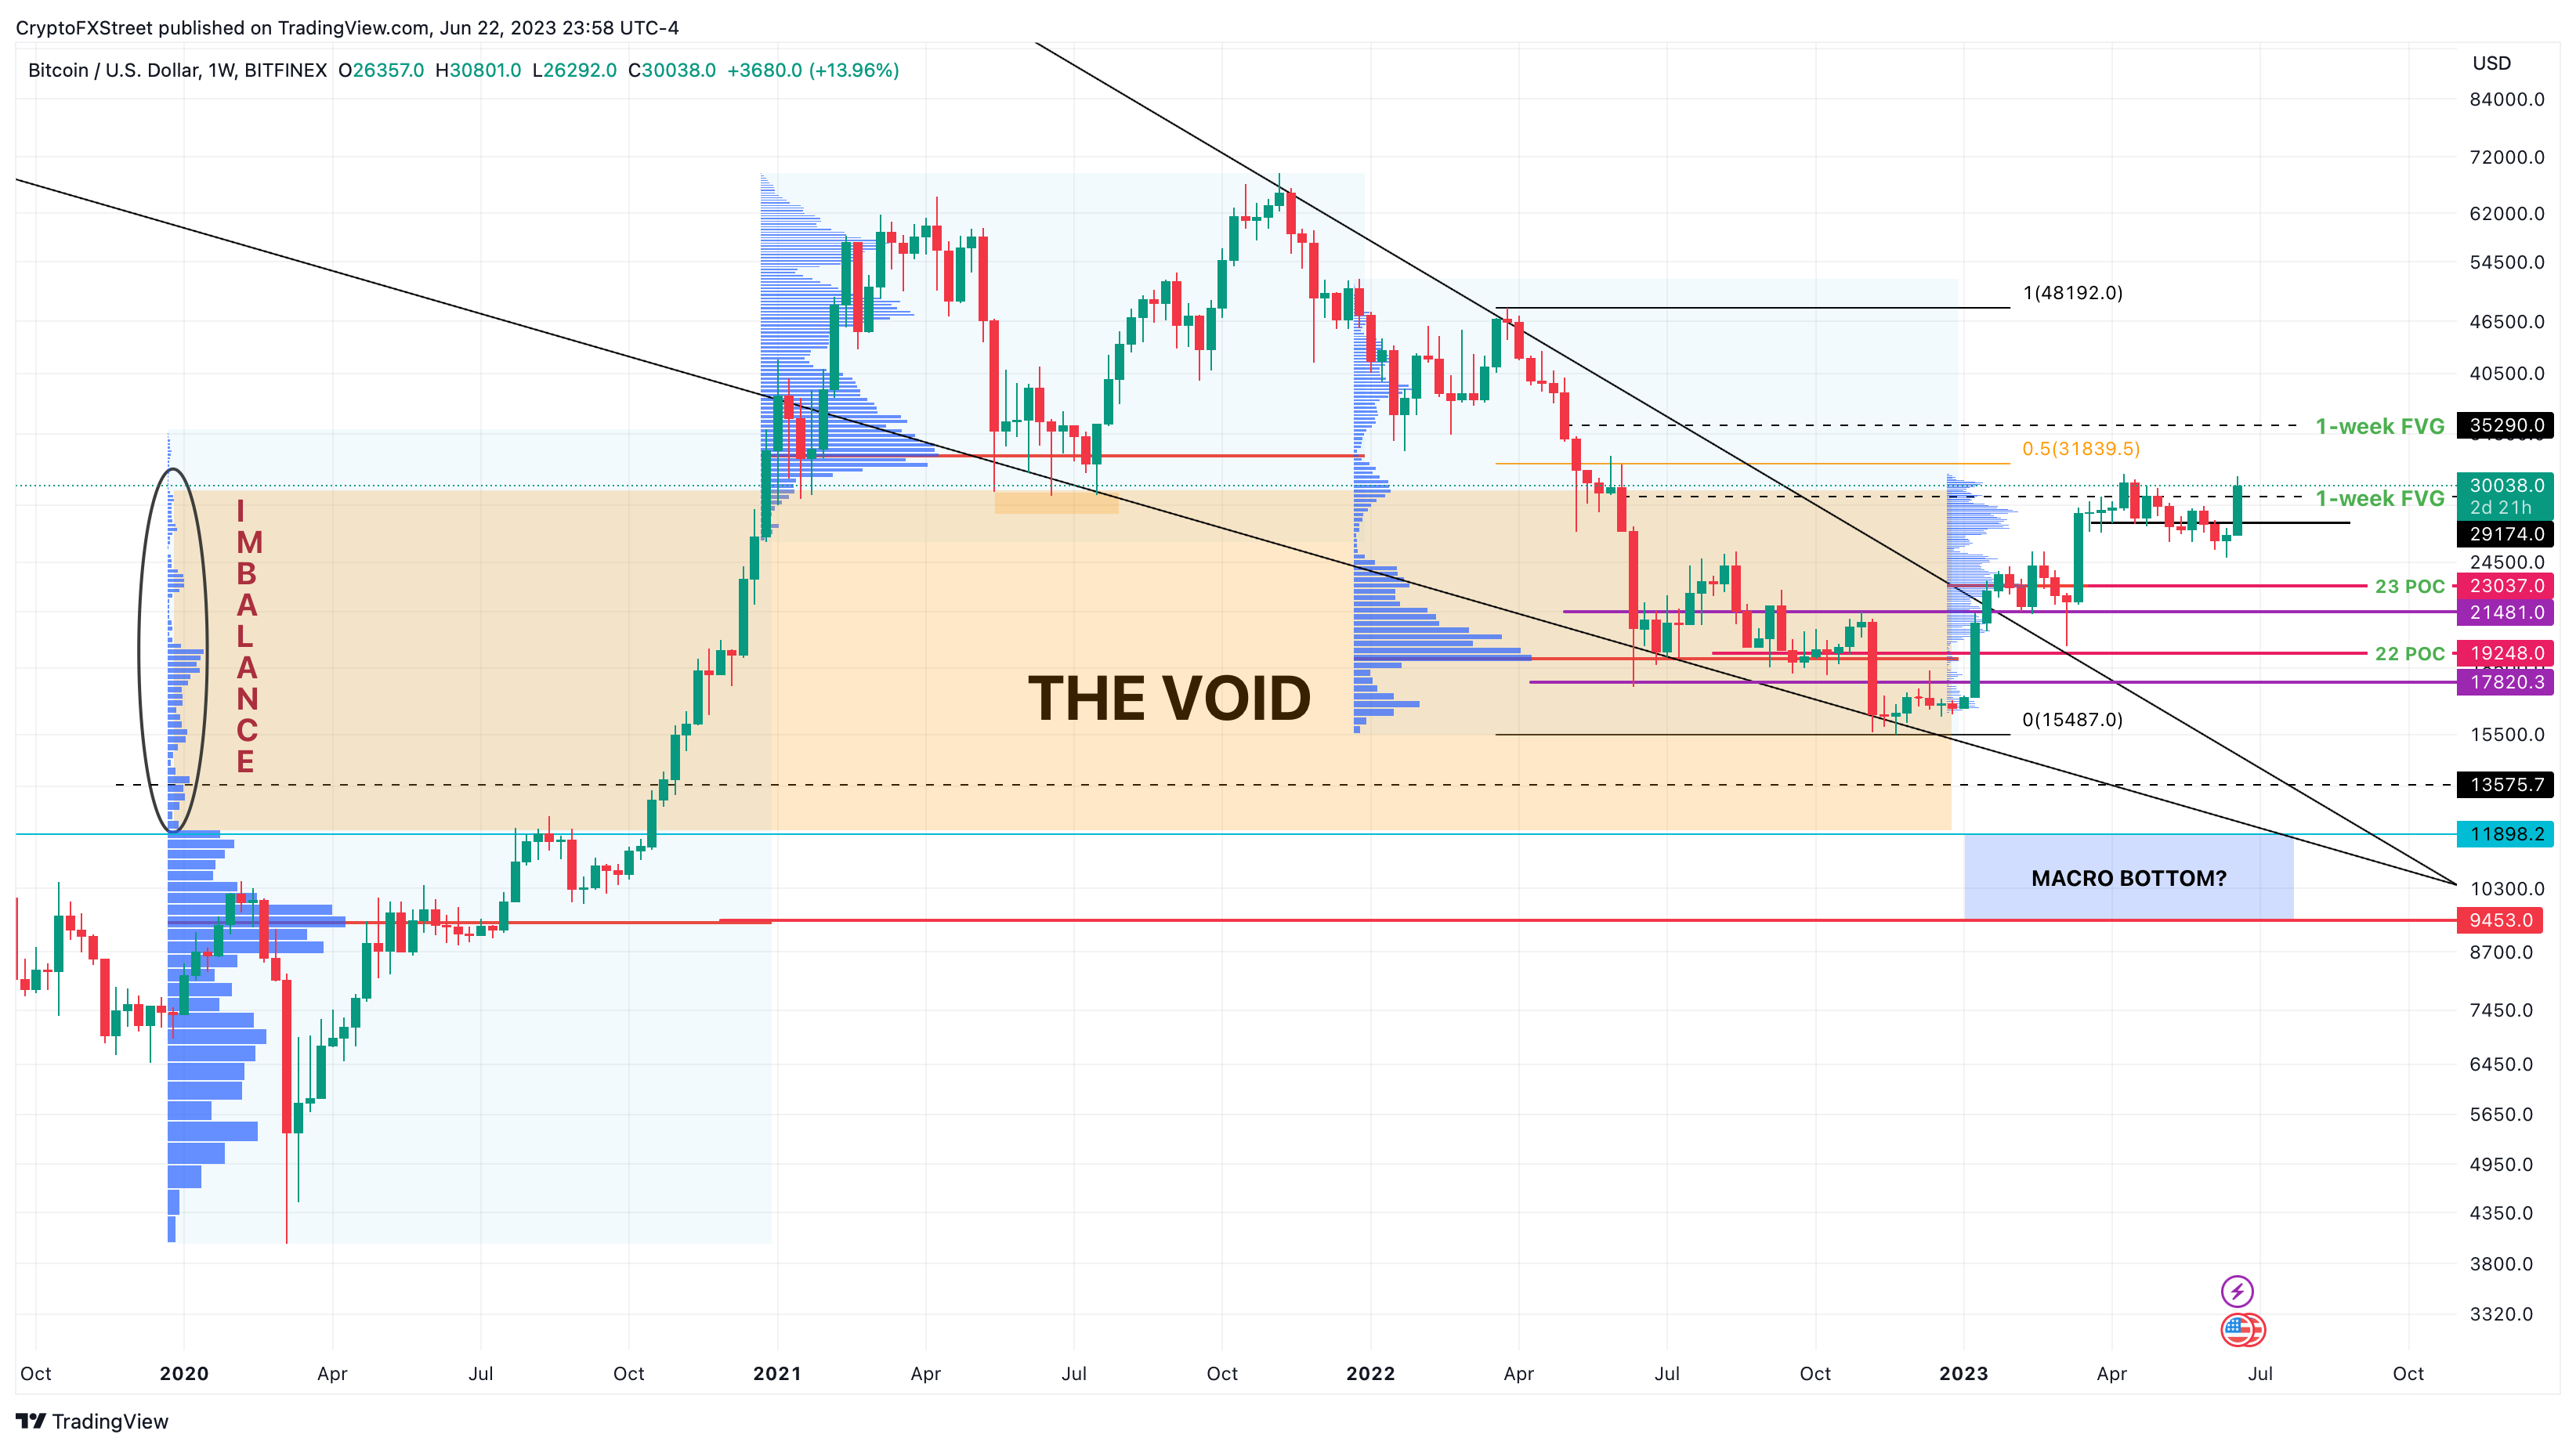
The weekly chart for Bitcoin price shows that it is very close to retesting $31,839, which is the midpoint of the range, extending from $48,192 to $15,487. From a long-term perspective, an ideal place for retracement would be after the retest of the $31,389 hurdle.
In its attempt to tag the midpoint, Bitcoin price might retest the weekly inefficiency at $35,290, which could form a local top.
As noted in previous publications, the Bearish Breaker’s midpoint on the weekly timeframe sits at $35,260, coinciding closely with the weekly inefficiency noted above. Hence, this confluence is most likely going to be a profit-taking area for short-term holders.
BTC/USDT 1-week chart
For more information on the long-term outlook of Bitcoin price, what long-term holders are up to, and the state of key on-chain metrics, read this: Three reasons why Bitcoin’s 2023 rally is just starting
Bitcoin price from a three-day timeframe
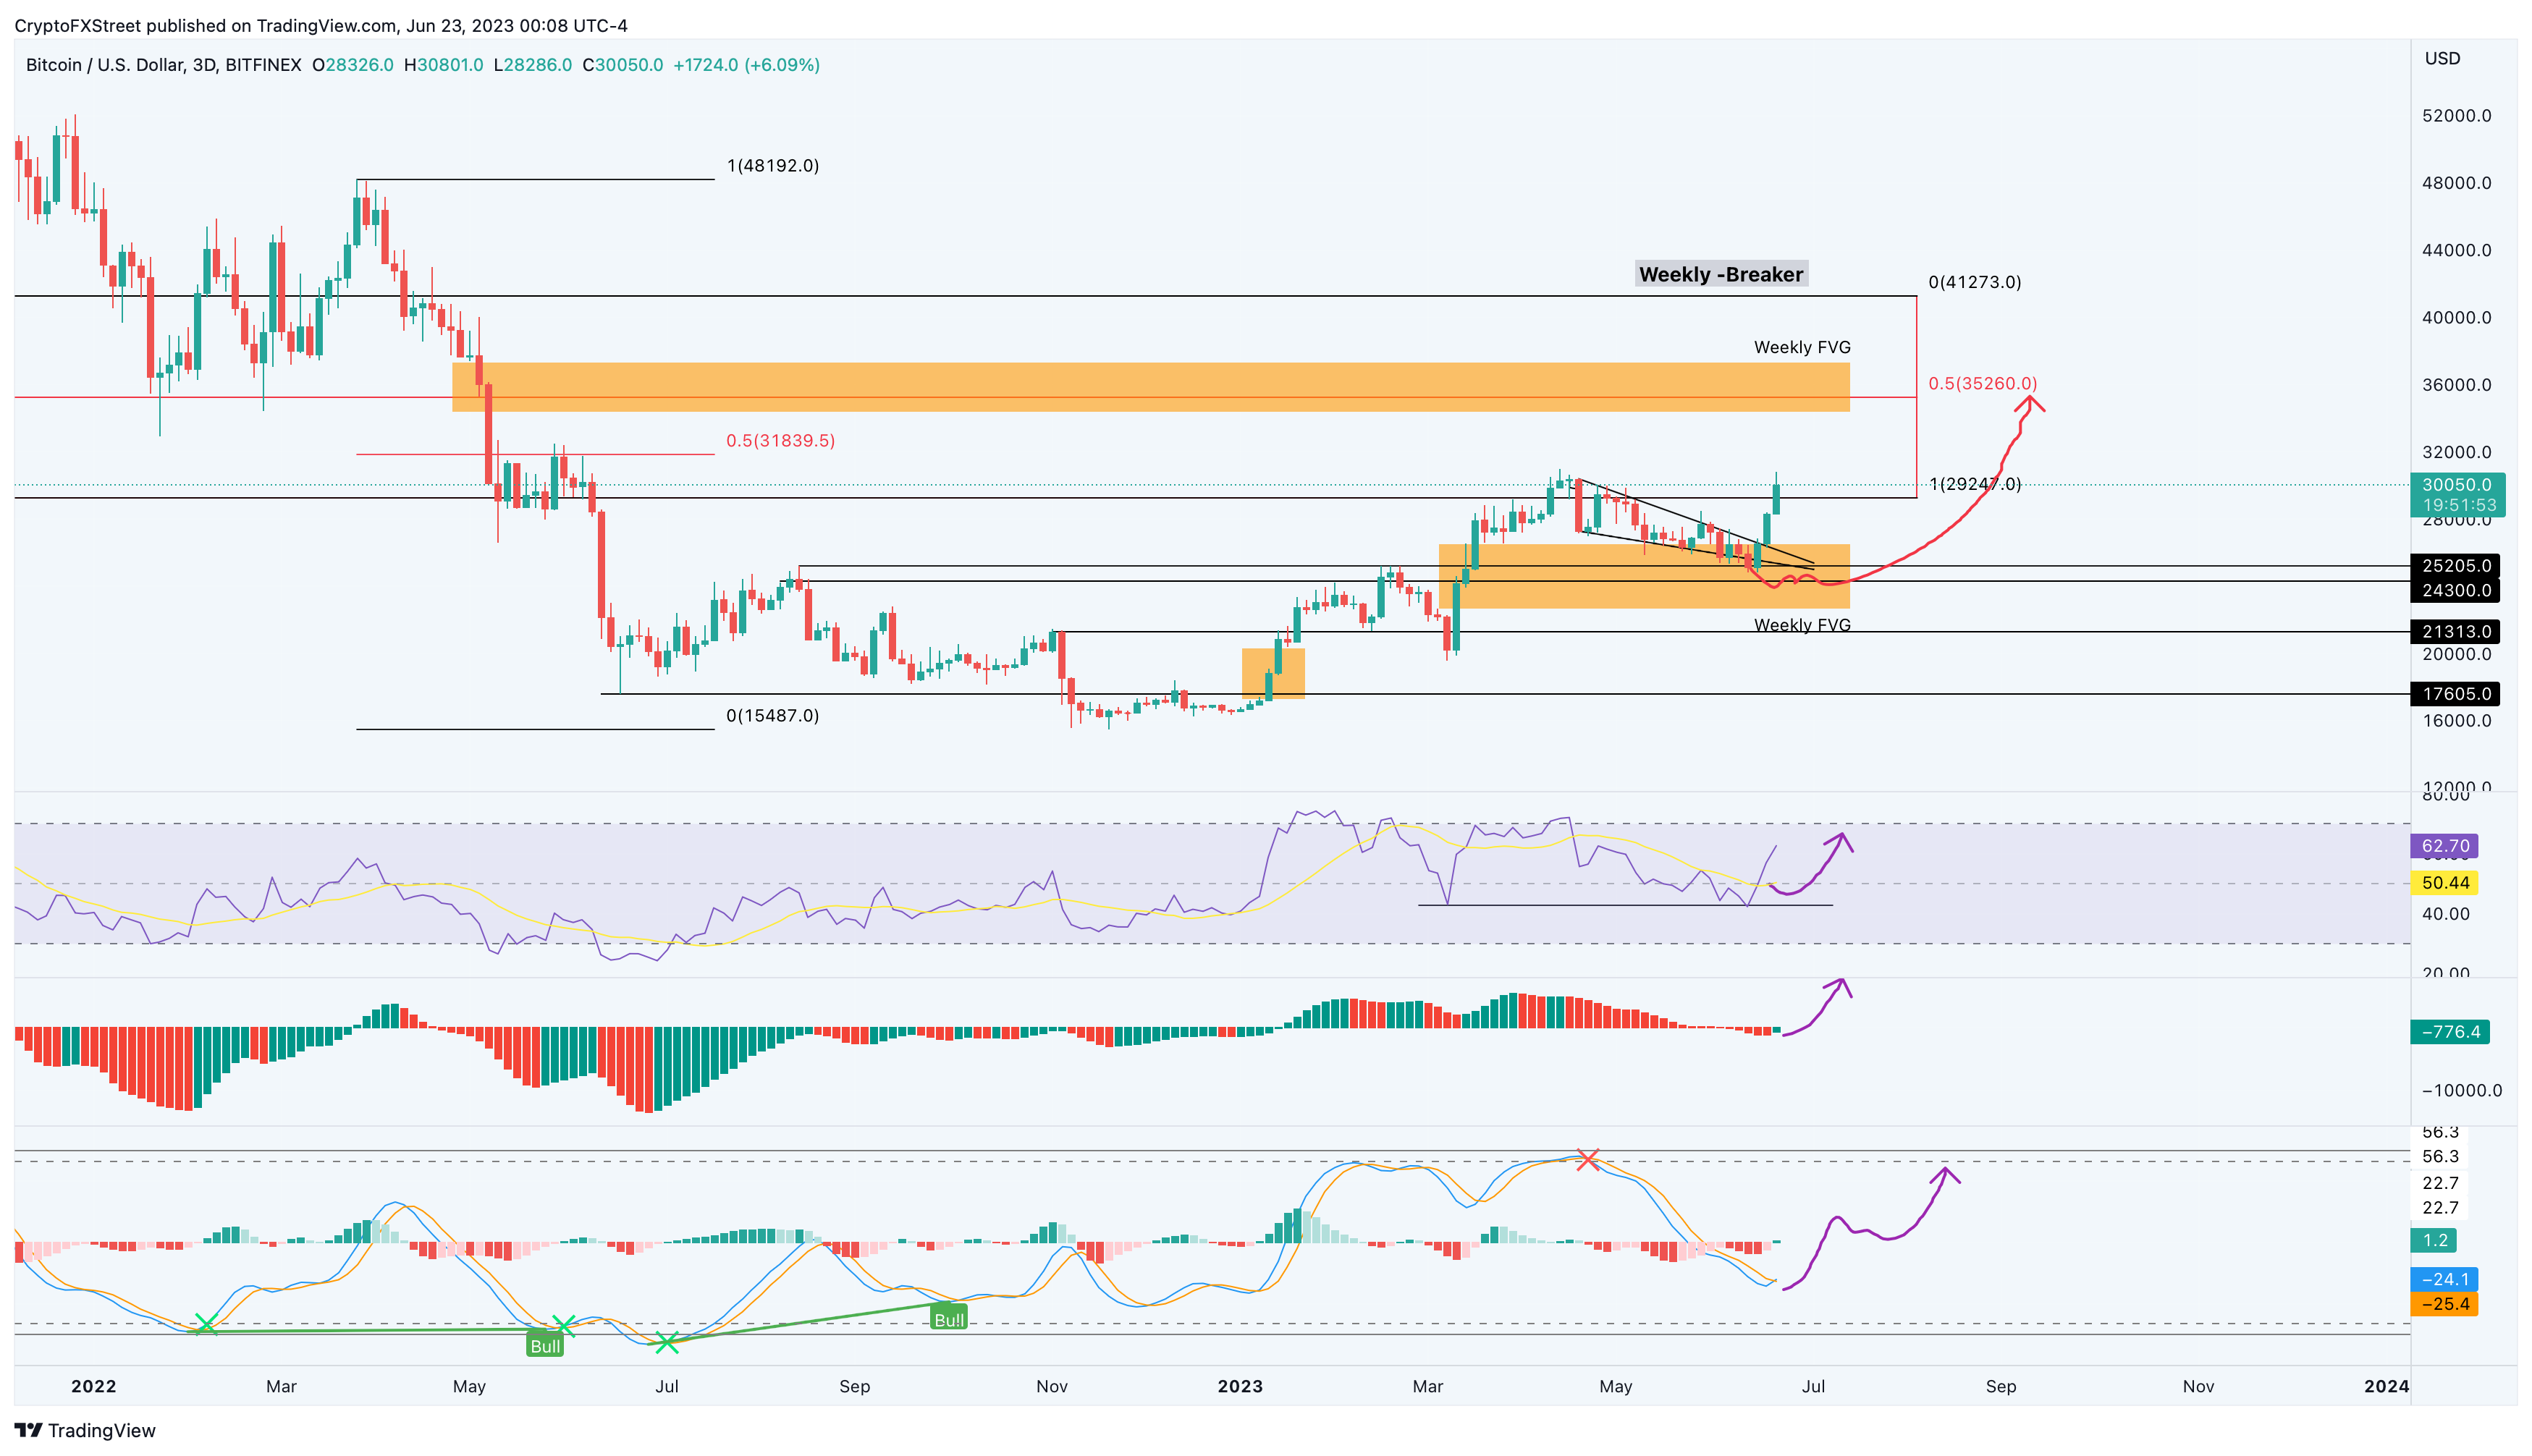
The three-day chart for Bitcoin price paints a much more nuanced picture. While not a lot has changed from a price action perspective, the indicators are critical to understanding if BTC will rally or not.
The Relative Strength Index (RSI) has created a double bottom at 42 and has recovered above the mean level at 50, suggesting a rise in bullish momentum.
The Awesome Oscillator (AO) denoted a bearish regime as it produced red histogram bars below the zero-line. But the outlook is changing after the recent uptick in Bitcoin price, which has caused the histogram bars below the zero-line to turn green and attempt a crossover.
A flip above the zero-line will add credence to the rising bullish momentum.
Lastly, the Wave Trend indicator for Bitcoin price shows signs of a potential bullish crossover below the zero-line, hinting at the extension of the 2023 bull rally.
All of these signs suggest that the bull rally for Bitcoin price on a three-day chart is yet to begin.
BTC/USDT 3-day chart
Bitcoin price from a daily timeframe
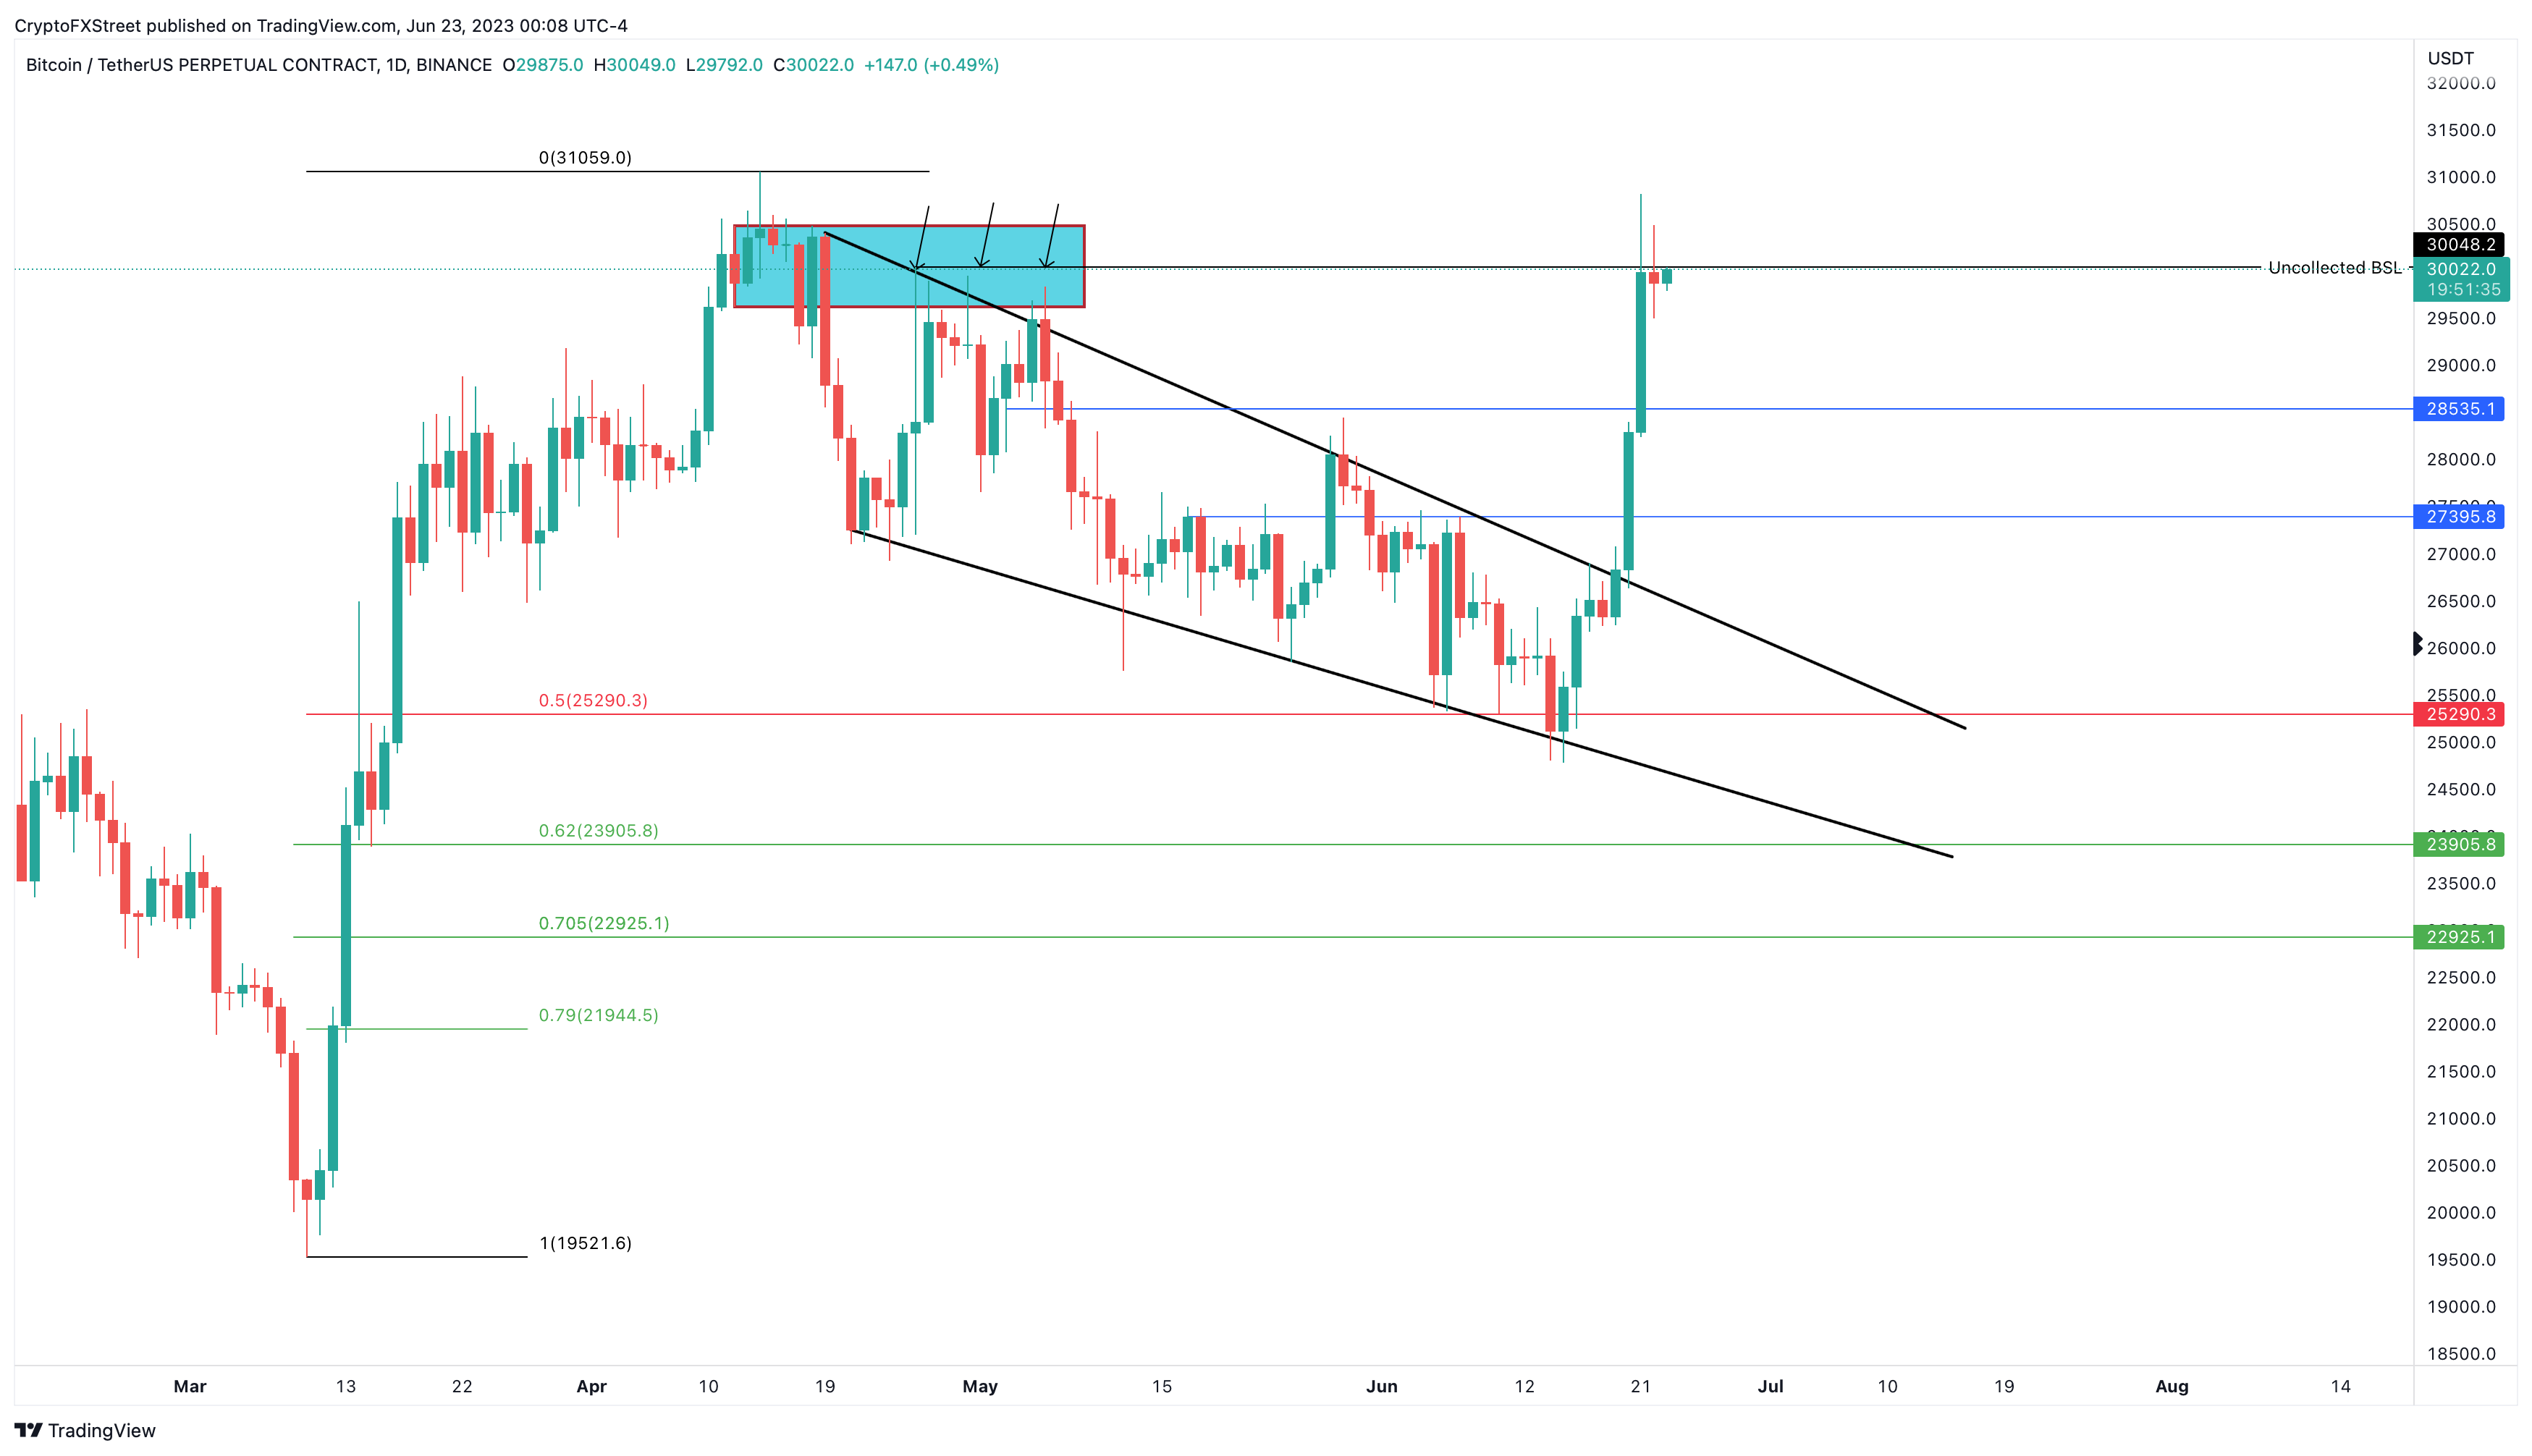
The daily chart for Bitcoin price shows that the recent rally collected the buy-side liquidity resting above the swing highs formed between April 26 and May 6 at roughly $30,000. The chances that this uptrend continues are pretty low, considering that the weekend is around the corner.
Therefore, investors can expect Bitcoin price to consolidate and form a range. A minor retracement to $28,545 seems plausible should short-term investors decide to book profits. But investors need to be patient trading in this timeframe.
BTC/USDT 1-day chart
Author

Akash Girimath
FXStreet
Akash Girimath is a Mechanical Engineer interested in the chaos of the financial markets. Trying to make sense of this convoluted yet fascinating space, he switched his engineering job to become a crypto reporter and analyst.


