Bitcoin Weekly Forecast: Road to $52,000 is paved
- Bitcoin price shows clusters of support confluence around $42,000 to $40,000.
- On-chain metrics are and have remained bullish for quite some time.
- A daily candlestick close below $40,490 will invalidate the bullish thesis for BTC.

Bitcoin price is at an interesting point in its journey over the past three weeks. After breaching a massive hurdle, BTC continued heading higher but has retraced over the last three days. Despite the recent drawdown, BTC has a high probability of an uptrend.
Bitcoin price eyes two significant levels
Bitcoin price dropped 10% between April 5 and 7 and set up a swing low at $42,714. This downswing induced fear among retail investors but is not a threat due to the cluster of support, ranging from $42,000 to $40,000, comprising of the daily demand zone, a bullish crossover of the 50-day and 100-day Simple Moving Average (SMA).
Therefore, the downside for all intents and purposes is capped above the demand zone, extending from $40,900 to $42,316. As for the upside, the Bitcoin price needs to reclaim the yearly open at $46,198 to have any chance of upside.
Doing so could result in a buying spurt that propels the big crypto to retest the 200-day SMA at $48,249. Clearing this hurdle is a tall task and is unlikely with half-cocked bullish momentum. In such a case, BTC might wick up to the $50,000 psychological level and not sustain above it.
However, a massive surge in buying pressure that causes BTC to produce a decisive close above this significant level will open the path for more gains. Investors can expect the $52,000 barrier to be the last and stiff line of resistance for the bulls. Hence, it is more than likely that the upside of BTC is capped around this barrier.
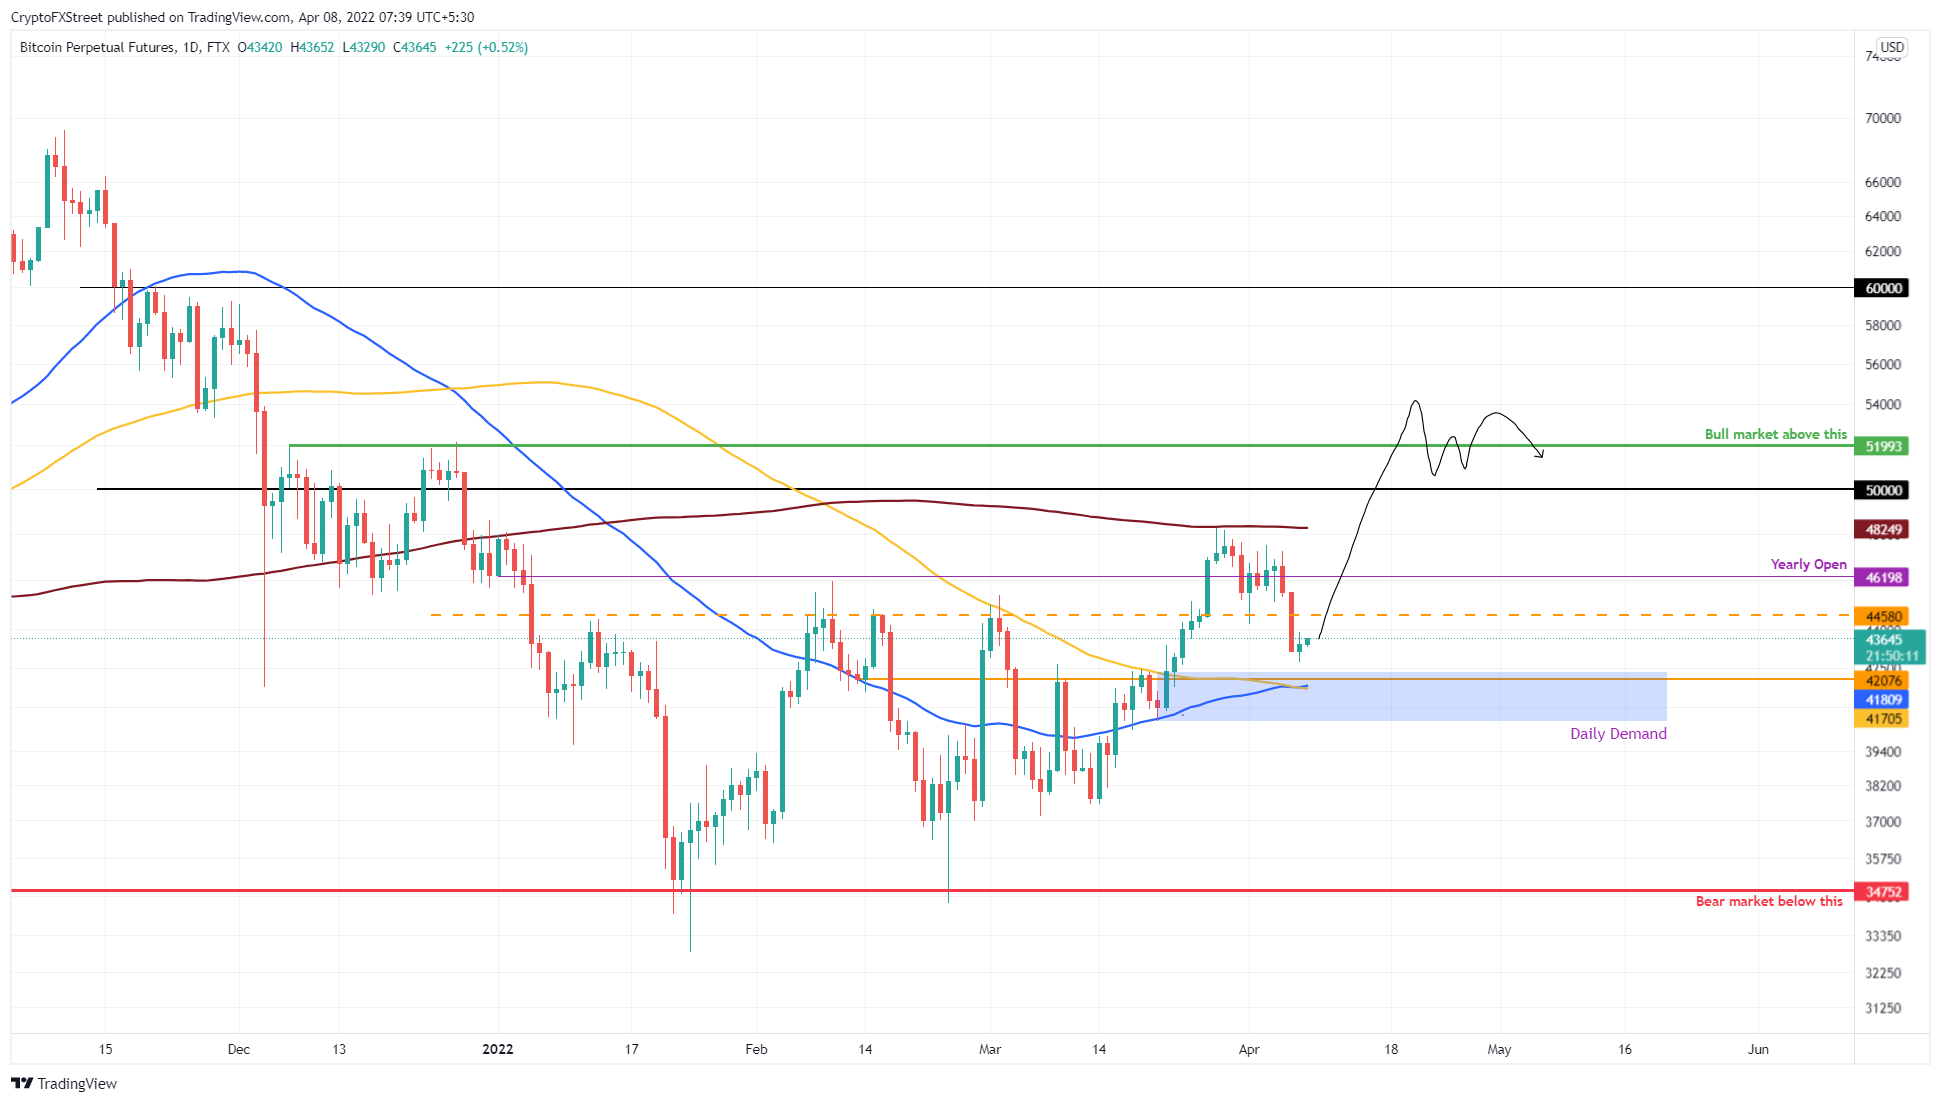
BTC/USDT 1-day chart
Supporting this up move for Bitcoin price is IntoTheBlock’s Global In/Out of the Money (GIOM) model. This index shows that the immediate resistance barrier extends from $45,235 to $50,491. Here, roughly 6.4 million addresses that purchased roughly 3.32 million BTC are “Out of the Money.”
Interestingly, this area harbors the 200-day SMA and the $50,000 level forecasted from a technical standpoint. Therefore, the upside could prematurely be capped at $50,000.
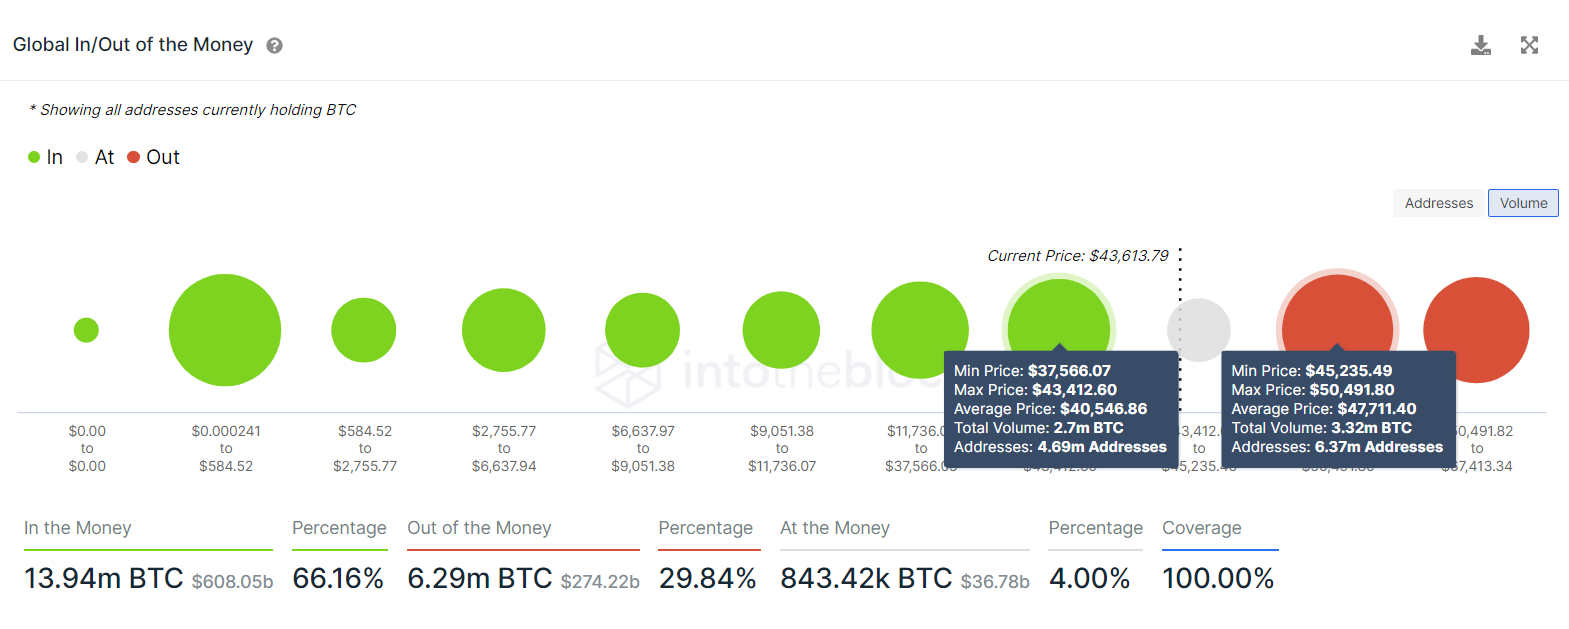
BTC GIOM chart
The supply distribution of whales holding 1,000 to 100,000 BTC shows a massive accumulation since June 2021. More recently, the wallets holding between 1,000 to 10,000 BTC have increased from 2,034 to 2,166.
The same trend can be seen for wallets holding 10,000 to 100,000 BTC, whose number has increased from 78 to 85. This uptick in the holdings of institutions only indicates that whales are optimistic about the performance of the Bitcoin price.
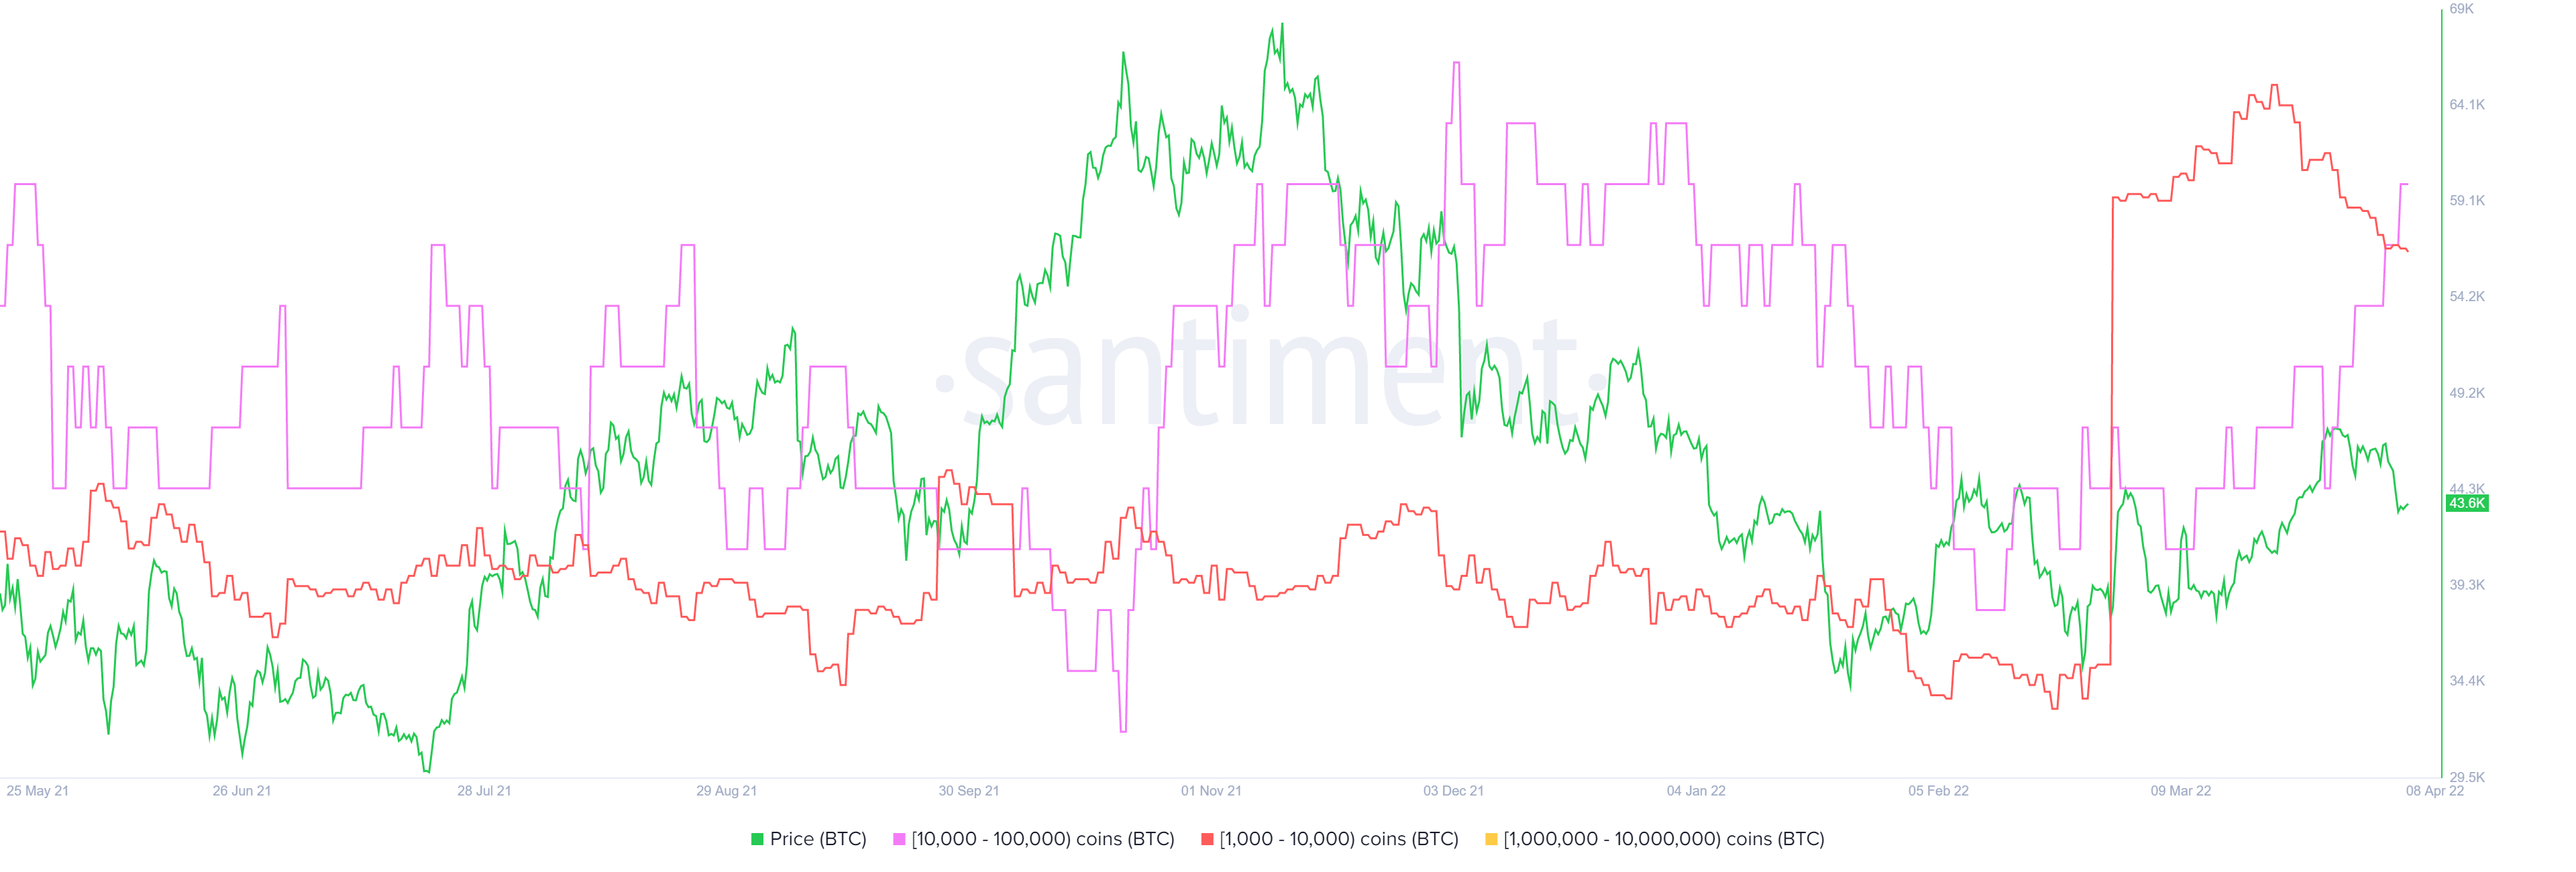
BTC supply distribution
Lastly and perhaps the most bullish outlook for Bitcoin price is the net exchange position change metric. This metric tracks the outflow of tokens from exchanges and since March 7, roughly 100,000 BTC have left centralized exchanges.
Such a massive outflow has happened five times in the history of BTC and the most recent one is the sixth such transfer. This on-chain index, like others, also indicates that long-term holders are extremely optimistic about the performance of Bitcoin price.
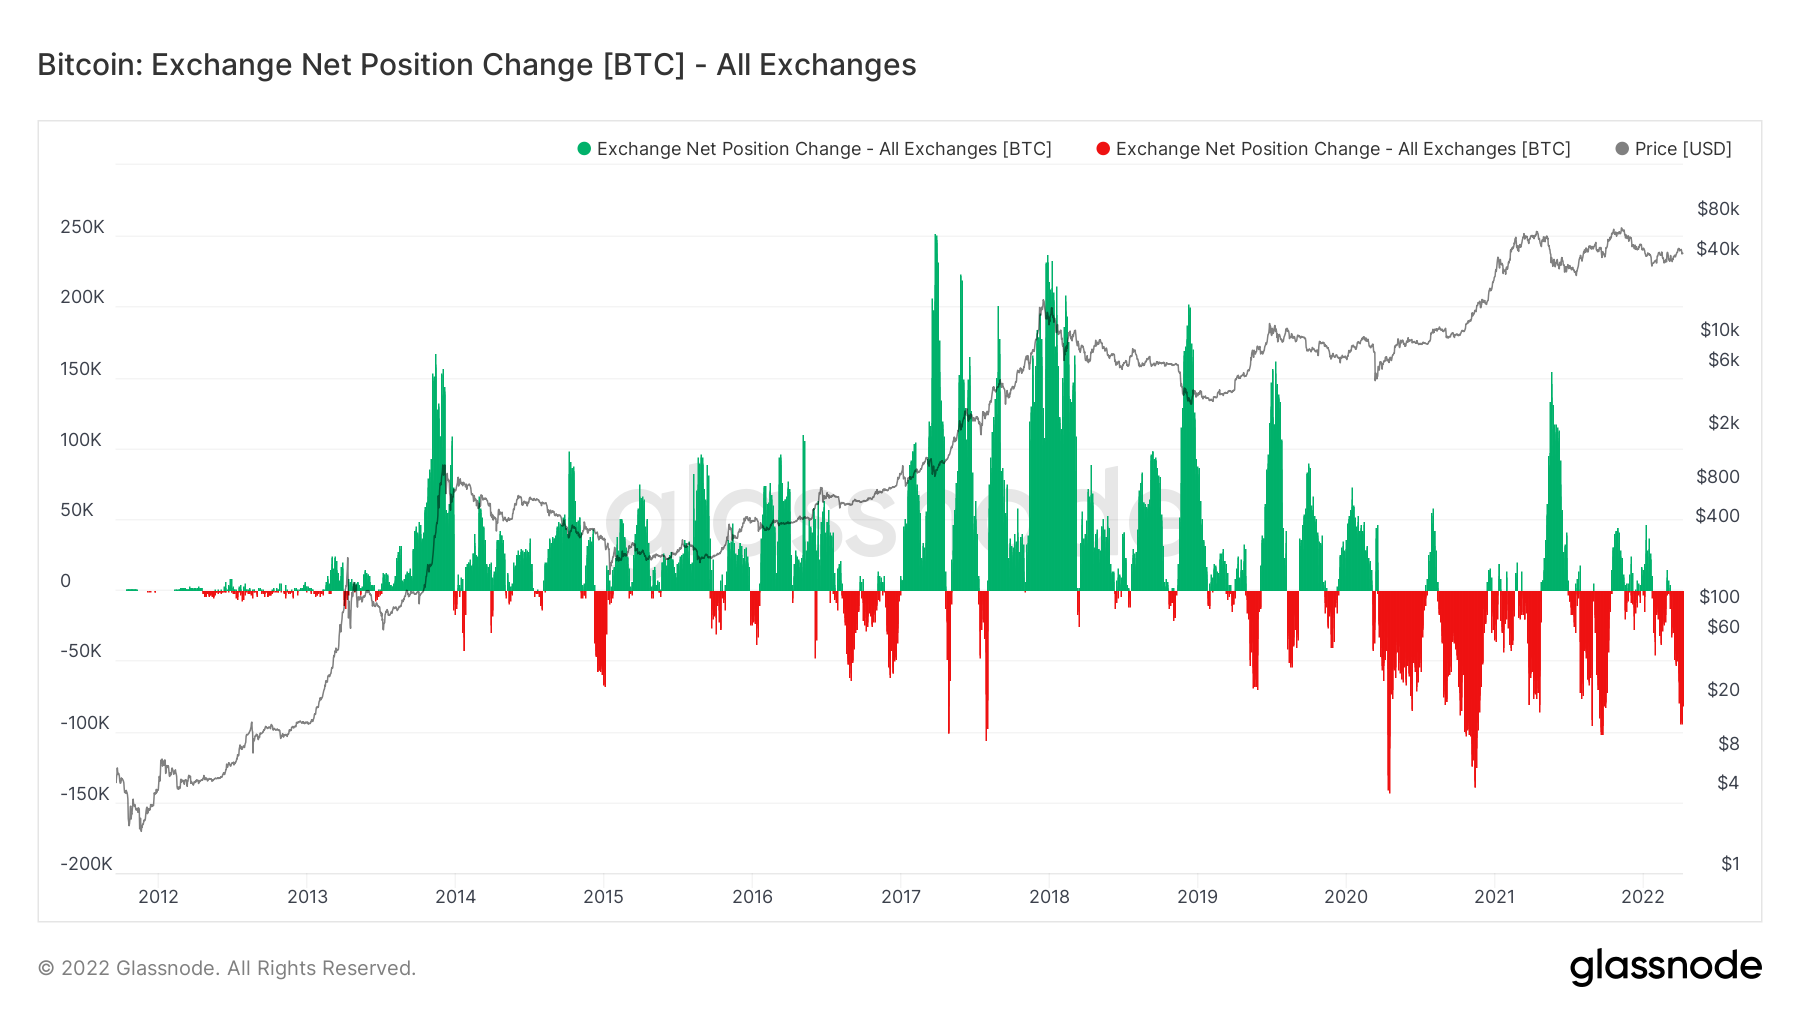
BTC net exchange position change
If Bitcoin price produces a daily candlestick close below $40,490, it will invalidate the demand zone and hence the bullish thesis. Such a development could send the big crypto crashing to the next support level at $34,752.
In a highly bearish case, a breakdown of this foothold could cause the Bitcoin price to trigger a crash to $30,000.
Author

Akash Girimath
FXStreet
Akash Girimath is a Mechanical Engineer interested in the chaos of the financial markets. Trying to make sense of this convoluted yet fascinating space, he switched his engineering job to become a crypto reporter and analyst.


