Bitcoin Weekly Forecast: It's all about whales again
- Bitcoin whales create tsunami waves on the market.
- BTC/USD may be poised for another bout of volatility.
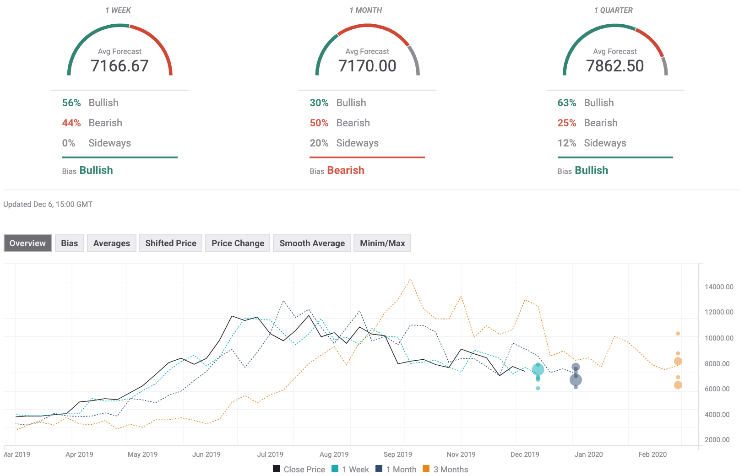
- FXStreet's Forecast Poll shows modest bullish bias.

On the cryptocurrency market, regulators, governments and central bankers and other big names like that are inferior to whales when it comes to generating trends and price movements. This week has offered another confirmation of this simple truth.
Bitcoin (BTC) performed an acrobatic feat by jumping from $7,200 to $7,770 and back to $7,000 just in a matter of hours. What's more, despite all these wild gyrations, the firs digital coin is finishing the week more or less at the same levels it was started.
At the time of writing, BTC/USD is changing hands at $7,360, down 4% in recent seven days and unchanged on a day-to-day basis. From a longer-term perspective, the coin has lost over 20% in a month, extending its downside from the yearly high reached in June at $13,924.
The big fish in a cryptocurrency pond
The wild price moves that shook the market in the middle of the week were caused by large Bitcoin transactions performed by the so-called whales - long-term cryptocurrency investors that have vast amounts of coins and able to move the market with a single transaction.
As we already reported, a Twitter service Whale alert registered a BTC transaction from Bittrex account to an unknown wallet the tune of $313 million. Shortly after that, someone transferred 57,577 Bitcoin ( $415 million) to the same platform. The transaction caught the eye of the community as it was made from 19 Bitcoin addresses with different amounts of coins that finally landed on a single and relatively new account.
Soon afterward, Whale alert reported that a large Bitcoin holder transferred Tether (USDT) worth of $70 million to the cryptocurrency exchange OKEx. Such transactions are often associated with an upcoming pump as large trades move USDT to a trading platform to buy some Bitcoins.
However, the pump was naturally followed by a dump as BTC failed to settle at new levels. Another series of whale transactions exasperated the sell-off: someone transferred about 56,000 BTC from Bittrex to 17 unknot wallets. Allegedly, those were the same coins that were deposited to Bittrex earlier on Wednesday. The community suspected that the platform was hacked, but Bittrex denied the allegations.
Bitcoin's long term picture
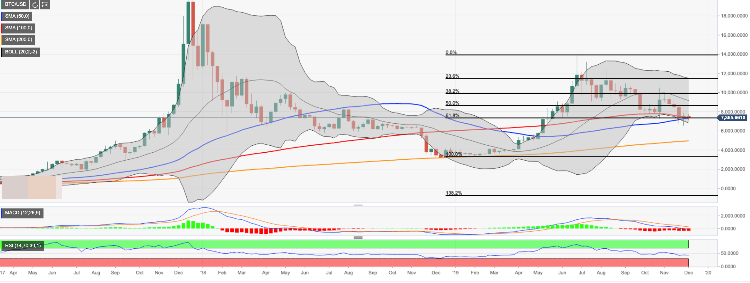
From the long-term perspective, BTC/USD is glued to pivotal $7,350. This technical area is created by 61.8% Fibo retracement for the upside move from $3,226 low to $13924 high and SMA50 (Simple Moving Average) weekly. The inability to move away from this area locks the price in a tight range and set the stage for a strong move in either direction once the breakthrough occurs.
On the upside, we need to pass $7,770 (this week's high) and $7,900 ( the highest level of the previous week), before we get to psychological $8,000. Once it is out of the way, BTC/USD will get a chance for an extended recovery; however, there is another strong barrier standing on its way. Strong resistance is located on the approach to $8,300 and strengthened by SMA50 (Simple Moving Average) and the middle line of the Bollinger Band on a daily chart. May cryptocurrency experts consider it to be a borderline that separates us from a sustained recovery.
Considering neutral RSI (the Relative Strength Index) on a daily chart, a strong upside move looks unlikely at this stage. However, an Evening Star candlestick pattern on a weekly chart implies that BTC is ripe for reversal. The pattern requires a confirmation in the form of another higher weekly close.
On the downside, Once $7,000 is out of the way, the sell-off is likely to gain traction with the next focus on $6,800-$6,750 ( the lower lines of the weekly and daily Bollinger Bands). This support area separates us from a deeper decline towards $6,500 (the lowest level the previous week). A sustainable move below this barrier will bring the sellers back to the market and create a pre-condition for an extended decline towards $5,000 reinforced by SMA200 (Simple Moving Average) on a weekly chart.
BTC/USD, the weekly chart
The Forecast Poll of experts improved since the previous week. The expectations on all timeframes turned bullish on weekly and quarterly timeframes, though stayed bearish on monthly timeframe. The average price forecasts stay below well 8,000. Moreover, an overview chart shows that average targets short-term timeframes declined. The 1-quarter average forecast improved from 7520 last week to 7862 this week, which means that analysts are more optimistic about Bitcoin's long-term outlook.
Author

Tanya Abrosimova
Independent Analyst


