Bitcoin vs. USD: Why only a weaker dollar will push BTC above $20,000

Investors should keep an eye on the tight inverse correlation between the strength of the U.S. dollar and Bitcoin.
A widespread debate among investors is the correlation of Bitcoin (BTC) with other markets. A high degree of correlation between the equity markets and Bitcoin has existed, particularly in the last few months. In other periods, gold and Bitcoin appear to move in tandem.
However, the correlation that should be watched the most is the dollar since the global economy is based on the strength or weakness of our world reserve currency, the United States dollar.
Weaker USD drove up Bitcoin prices in Q2, Q3 2020
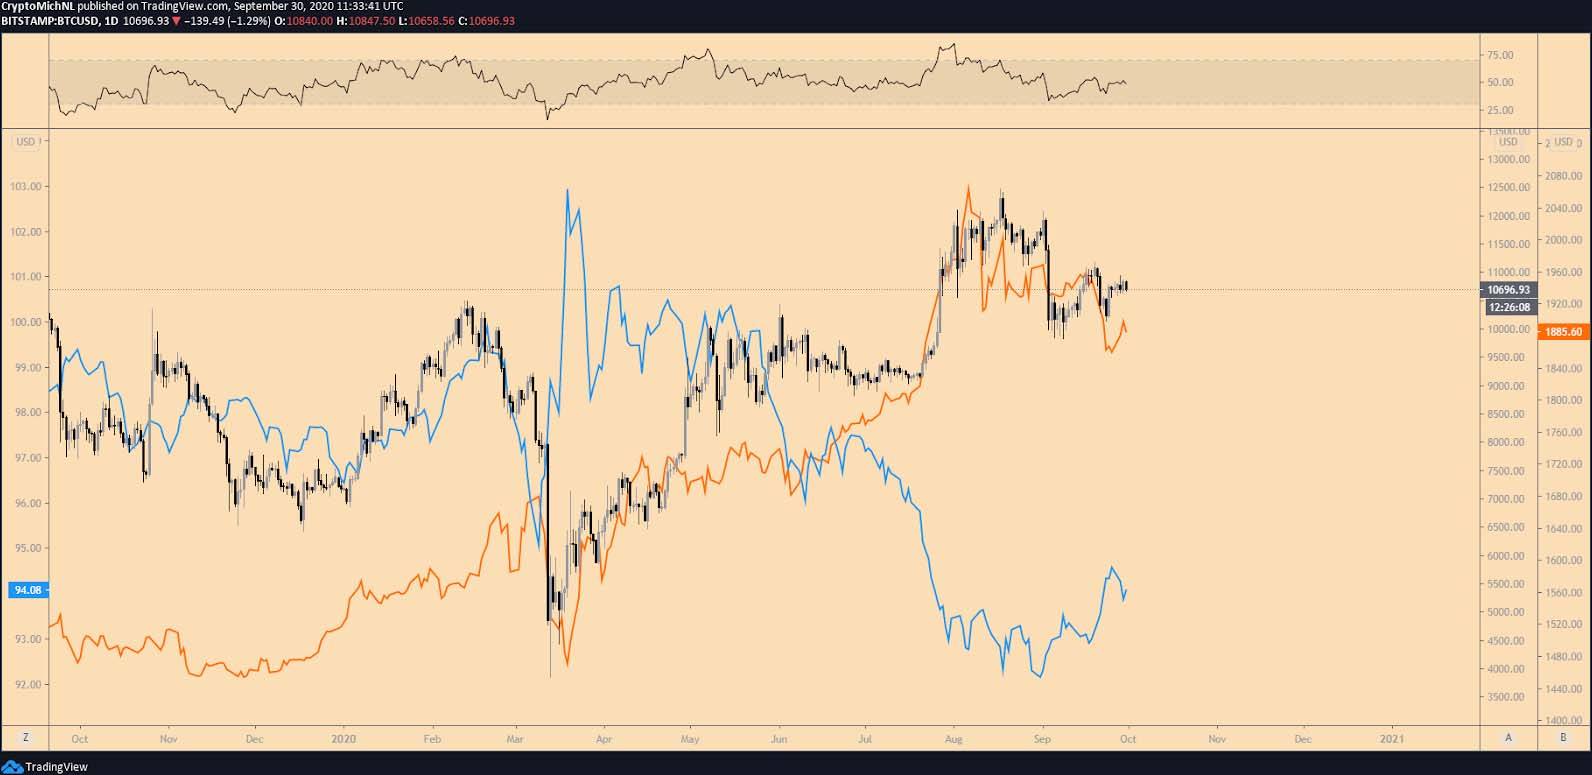
BTC/USD vs. Gold vs. DXY 1-day chart. Source: TradingView
The chart above shows gold, Bitcoin, and dollar values since the crash in March. The orange line is gold, the blue line the U.S. Dollar Currency Index (DXY), and the regular price of Bitcoin is shown by the black line.
The sudden impact of the global pandemic increased the demand for U.S. Dollars, surging heavily in March as seen by the large blue spike. This spike caused the other markets to tumble as the price of Bitcoin dropped by 50% to as low as $3,700.
However, since this massive crash, the DXY has been weakening day-by-day. This sudden weakness of the dollar caused other “safe haven” assets to rise significantly over the past six months. Bitcoin has increased 185% since the crash of March while Gold rallied 31%.
But despite the general downtrend still intact, the U.S. dollar has seen a relief bounce in early September as a bottom construction was made. A bullish divergence was created to mark the start of the temporary bottom pattern, after which the 92.75 level was reclaimed as support for further continuation upward.
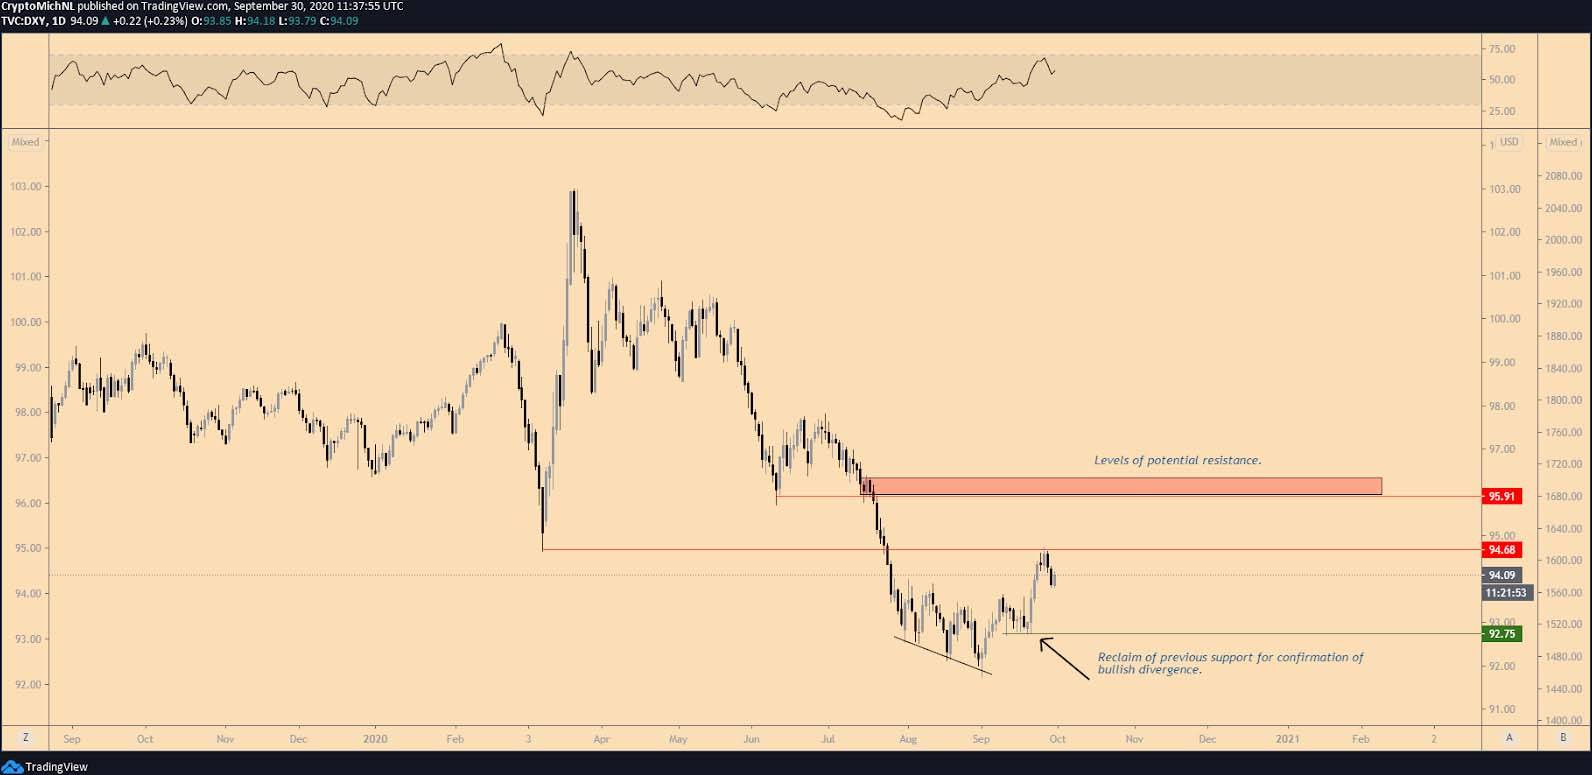
U.S. Dollar Currency Index 1-day chart. Source: TradingView
This relief rally reached 94.60 points and caused other assets to drop substantially. Hence, more weakness in the commodity and crypto markets should be expected if the DXY continues toward 96 points.
USD in 2016 and 2017 fueled the Bitcoin cycle
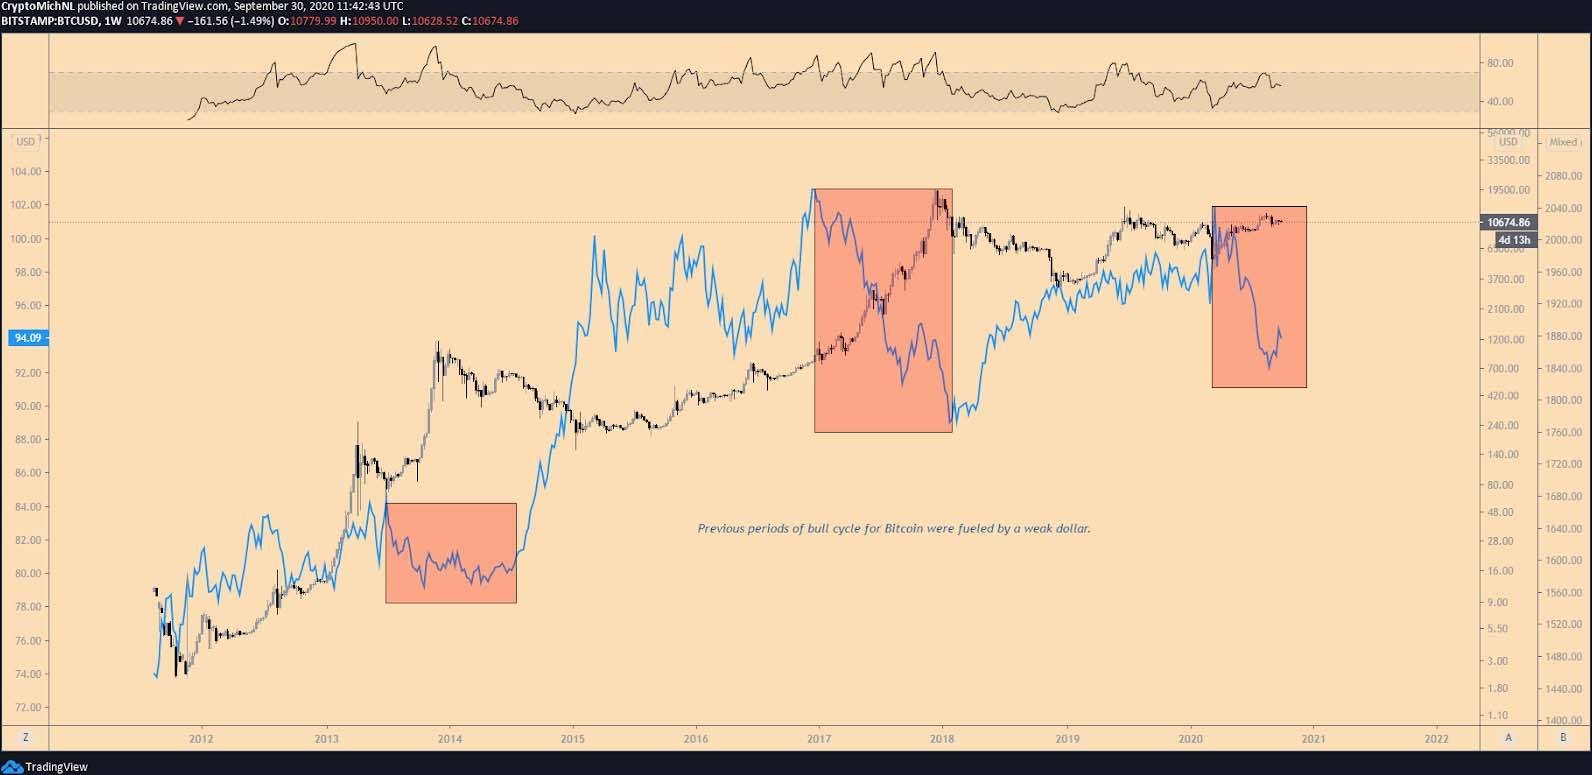
BTC/USD vs DXY 1-week chart. Source: TradingView
The previous cycle highs were hit in 2014 and 2017 for Bitcoin, through which credible data can be derived from the correlation between the U.S. Dollar and Bitcoin.
Throughout 2017, the U.S. Dollar showed significant weakness across the boards, as the EUR/USD pair rallied from 1.03 to 1.25 too. During this uncertainty and instability of the U.S. Dollar, Bitcoin had its peak rally from $1,000 to $20,000.
More interestingly is the fact that Bitcoin’s peak high is surrounded by the cycle low of the DXY index.
Since then, the DXY index has been showing some strength. Through this strength, the Bitcoin bear market was fueled until the previous months.
A substantial weakness of the DXY index is causing the price of Bitcoin and Gold to continue rallying. Is history going to repeat itself?
Dollar weakness after the Dot.com bubble lead to a 600% surge in Gold
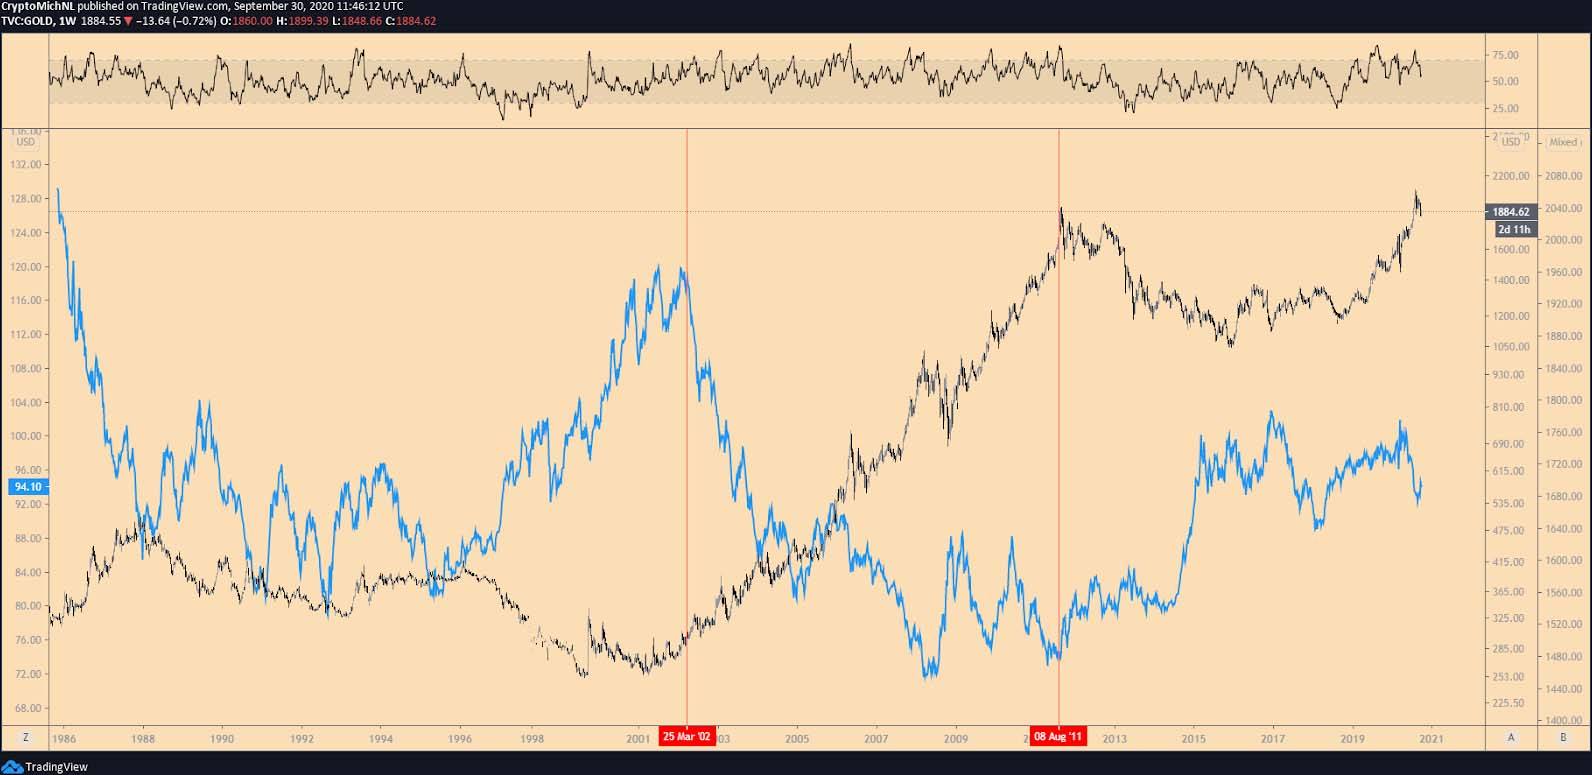
DXY Index vs. Gold 1-week chart. Source: TradingView
What can be derived from the chart above is the strength of gold since the dot com bubble popped in 2000. During the first stages of a potential crash is the liquidation phase when all markets drop as gold also corrected 30% in 2000. This is the hunt for liquidity to cover losses on the equity markets similar to what has been witnessed in March 2020.
However, since the USD showed weakness in 2000, gold has been showing tremendous strength as a safe haven, which would have increased your portfolio by 600%.
In the same period, the EUR/USD pair rallied from 0.85 to 1.60 in 2008. The momentum then flipped as investors flew to the USD as a hedge during the credit crisis.
But in the current times of uncertainty with negative interest rates, increased debt levels, and deflation, Bitcoin is also doing relatively well.
Of course, a potential drop by 25-35% could occur in the first stage of the crisis just like in March. But Bitcoin and gold would benefit significantly afterward as safe havens against a weakening dollar, which is precisely what happened in December 2017 as BTC hit its all-time high of nearly $20,000.
The simple reasoning for this is that confidence in governments will also drop during times of economic uncertainty, e.g. the corona pandemic or systematic risk. Given this uncertainty and exponentially growing debt, the U.S. central bank has one option: devalue the currency, which means further weakness for the dollar.
In other words, the prophecy of six-figure prices can become a reality if the dollar’s weakness continues into 20201.
Author

Cointelegraph Team
Cointelegraph
We are privileged enough to work with the best and brightest in Bitcoin.


