Bitcoin traders say ‘get ready’ as BTC price preps 2023 bull market

Bitcoin (BTC $30,245) is gearing up for its next bull run in classic style, say traders eyeing two key trend lines.
In some of their latest social media analysis, popular traders Moustache and Titan of Crypto revealed a BTC price breakout in the making.
Bitcoin “bull market line” eyes classic crossover
Bitcoin is closely copying prior BTC price cycles, and the time is almost right for a bullish surge, according to Titan of Crypto.
Uploading historical BTC/USD price data, he drew attention to the 21-week simple moving average (SMA), currently at $27,900 per Cointelegraph Markets Pro and TradingView.
Once this upward-sloping trend line clears the immediate spot price range, a protracted period of upside follows, giving the 21-week SMA its nickname — the “bull market line.”
Titan of Crypto called the phenomenon a “bull market kick off.”
“Once the weekly 21 MA crosses over BTC market structure it will kick off the Bull Market,” he forecast.
Be ready, it’s getting closer.
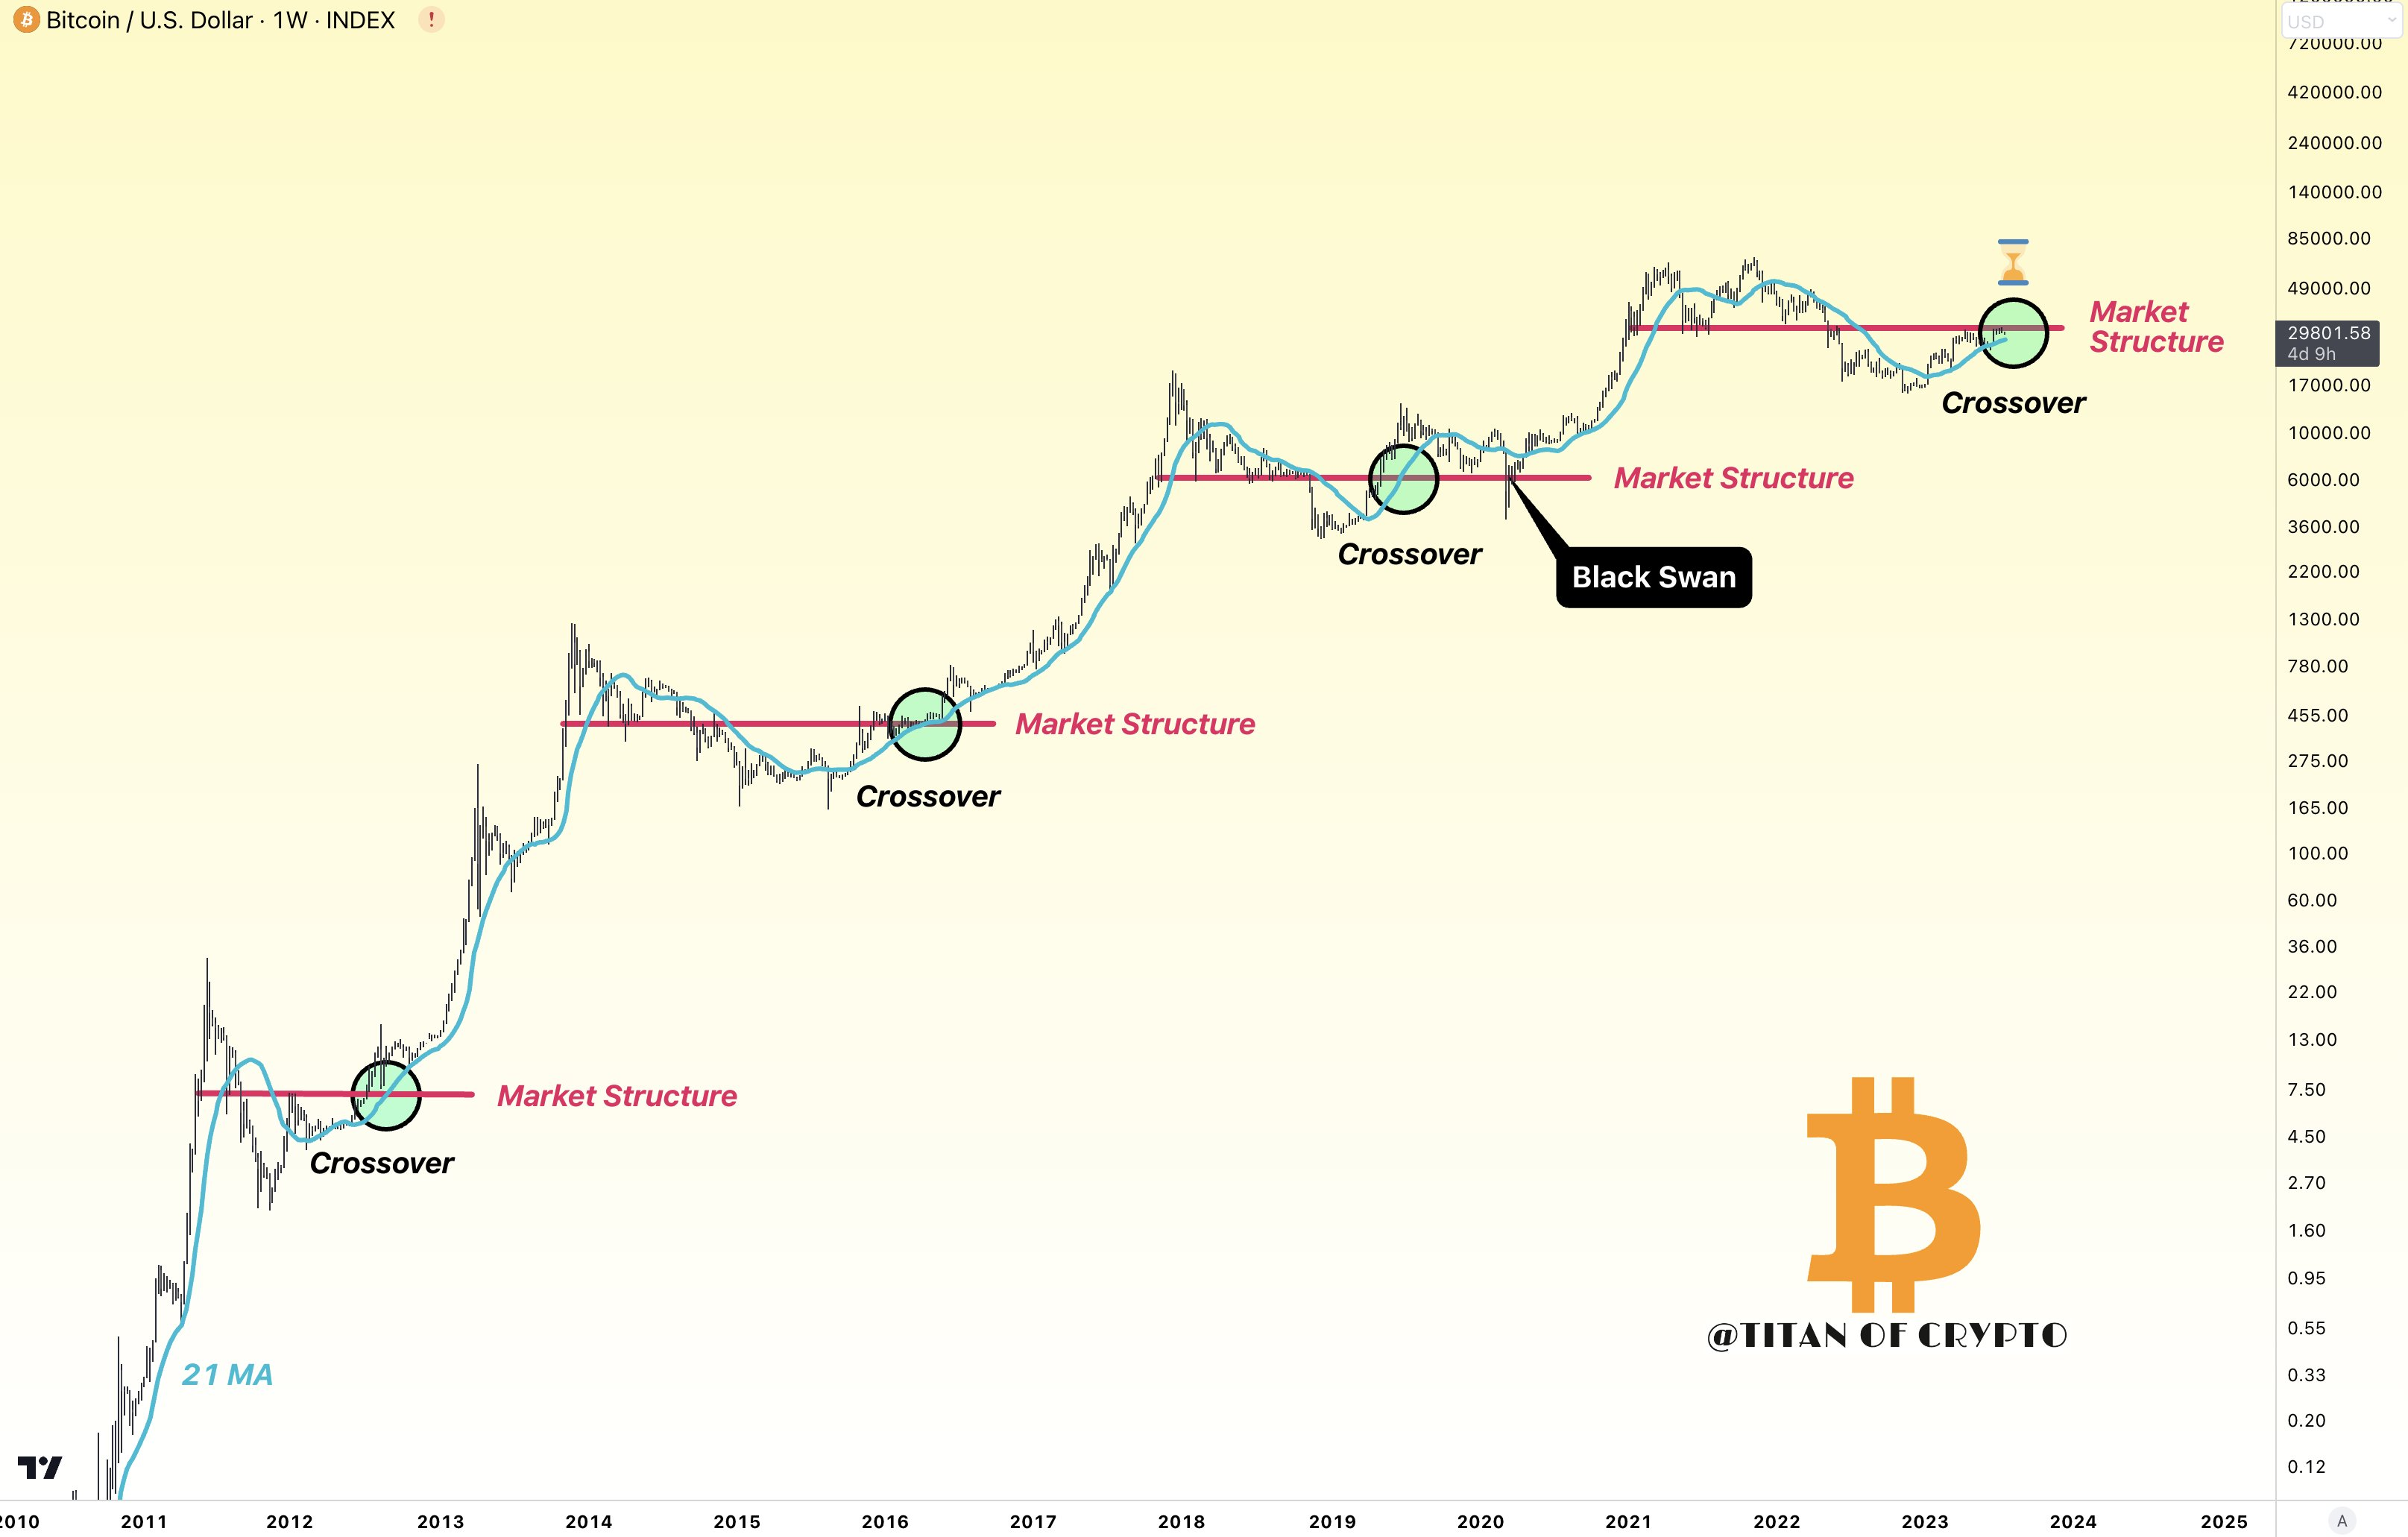
BTC/USD annotated chart with 21-week SMA. Source: Titan of Crypto/Twitter
Bitcoin’s last such MA cross occurred four years ago, in early 2019 — the same juncture as today’s price action during the previous cycle. This led to that year’s local high near $14,000.
March 2020 saw a brief undoing of the cross thanks to the COVID-19 cross-market crash, something Titan of Crypto calls a “black swan.”
Bitcoin trader: “Imagine being bearish” above $28,600
Another trend line on the radar concerns longer timeframes — the 20-month SMA.
This, Moustache notes, has heralded every previous Bitcoin bull market — a monthly candle close above the 20-month SMA has seen every subsequent candle also close above it until the cycle high. Here again, March 2020 forms a fleeting exception to the rule.
“Imagine being bearish, while $BTC holds above the monthly 20 SMA-line,” Moustache commented.
Once Bitcoin has closed above it, it has NEVER AGAIN fallen below it, until the cycle top. This is exactly how it was in 2016-2018 and 2019-2021.
The 20-month SMA currently sits at $28,585.
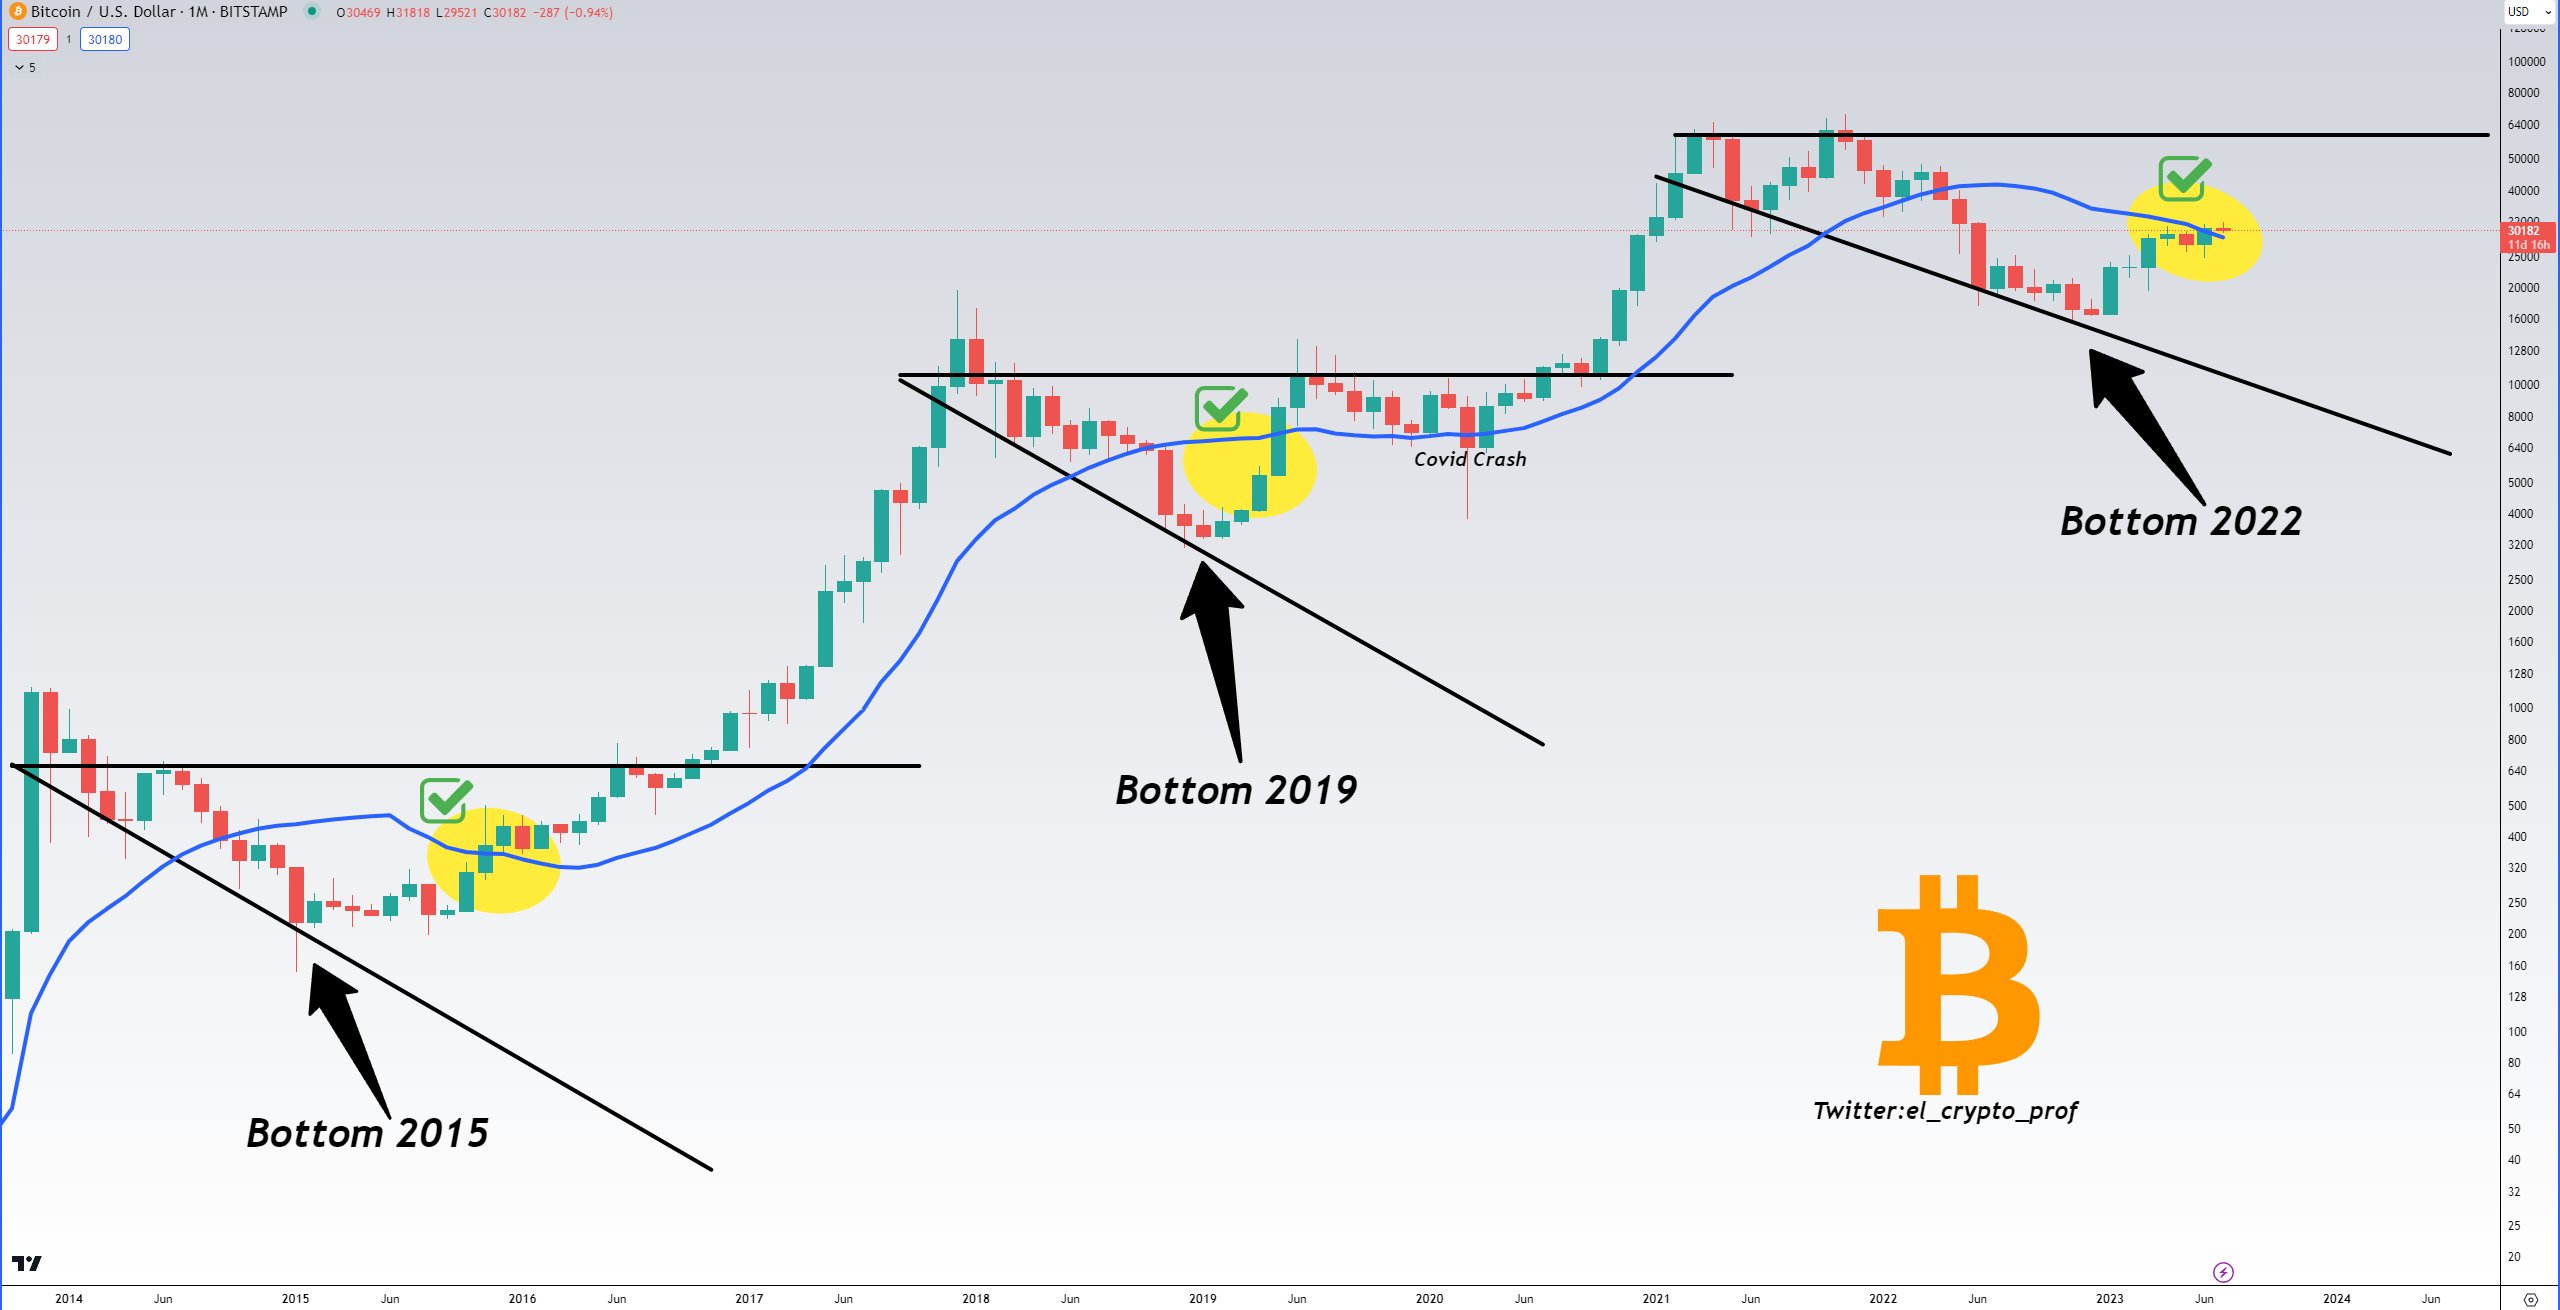
BTC/USD annotated chart with 20-month SMA. Source: Moustache/Twitter
As Cointelegraph reported, downside support remains tied to the 200-week SMA, along with various other daily and weekly trend lines functioning as a line in the sand during Bitcoin’s recent bear market.
Author

Cointelegraph Team
Cointelegraph
We are privileged enough to work with the best and brightest in Bitcoin.




