|

Bitcoin Technical Analysis: Buyers jumping out of the bulls wagon as BTC crashes below $6,000

BTC/USD weekly chart

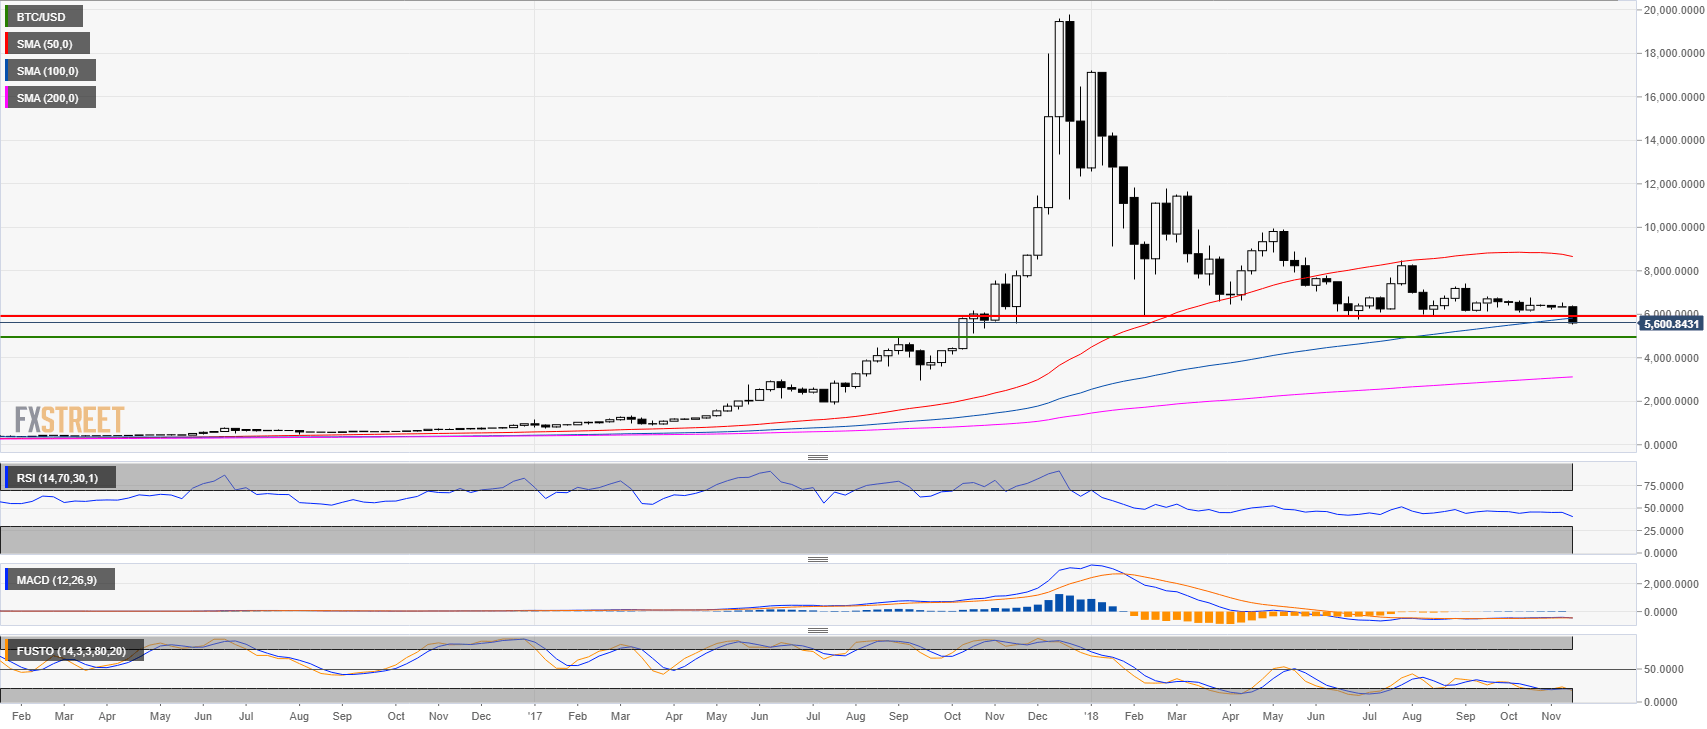
  • BTC/USD has tried to hold on above $6,000 for the most part of 2018. 
  • A break of the level open the gates to $4,979 (September 1, 2017). 

BTC/USD daily chart

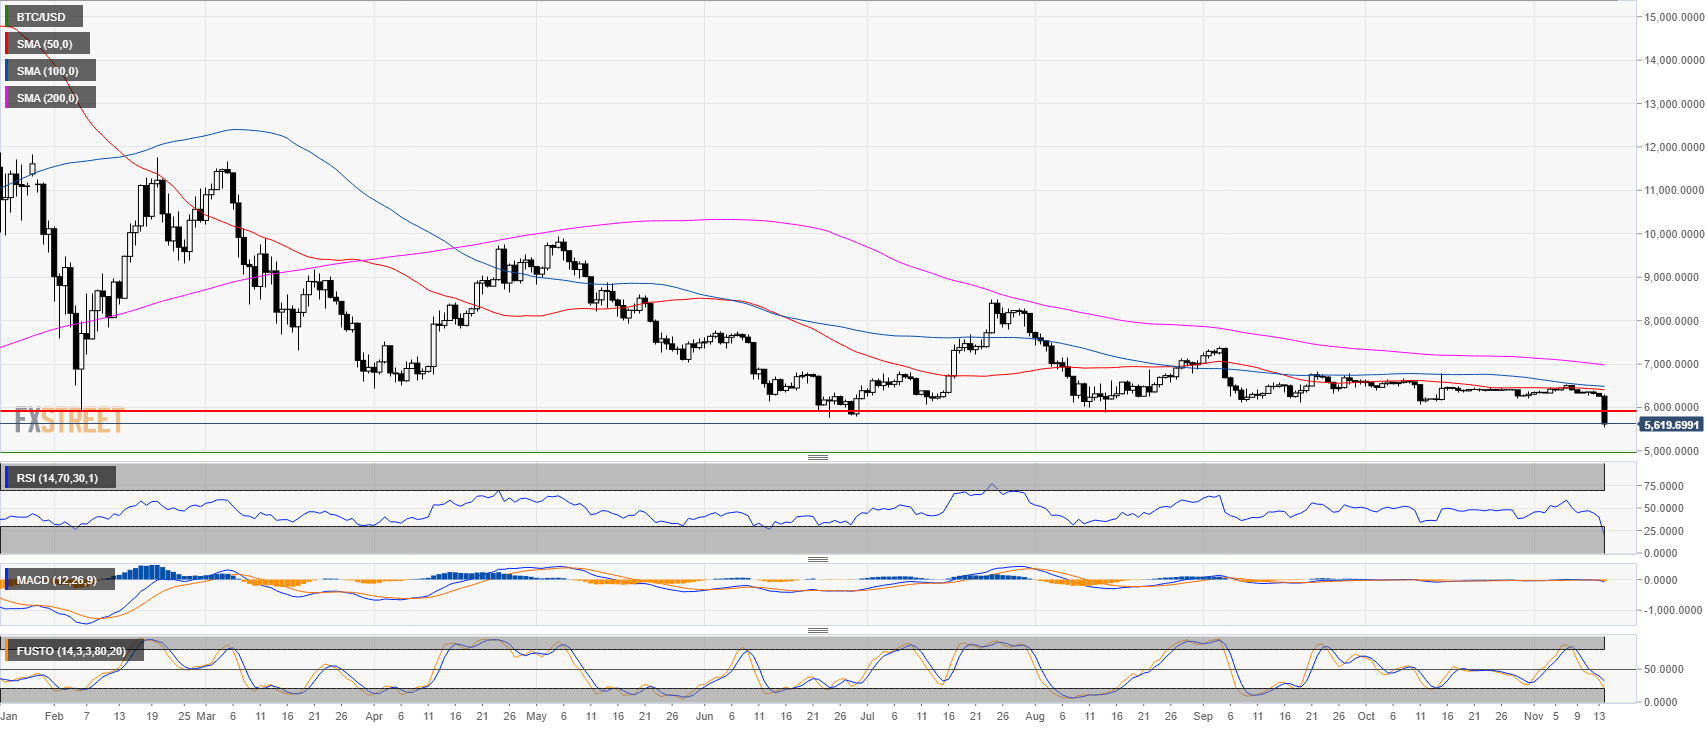
  • BTC/USD is trading below the 50, 100 and 200-day simple moving average suggesting a strong bearish bias. 
  • Technical indicators are in negative territories suggesting more losses ahead. 

BTC/USD 30-minute chart

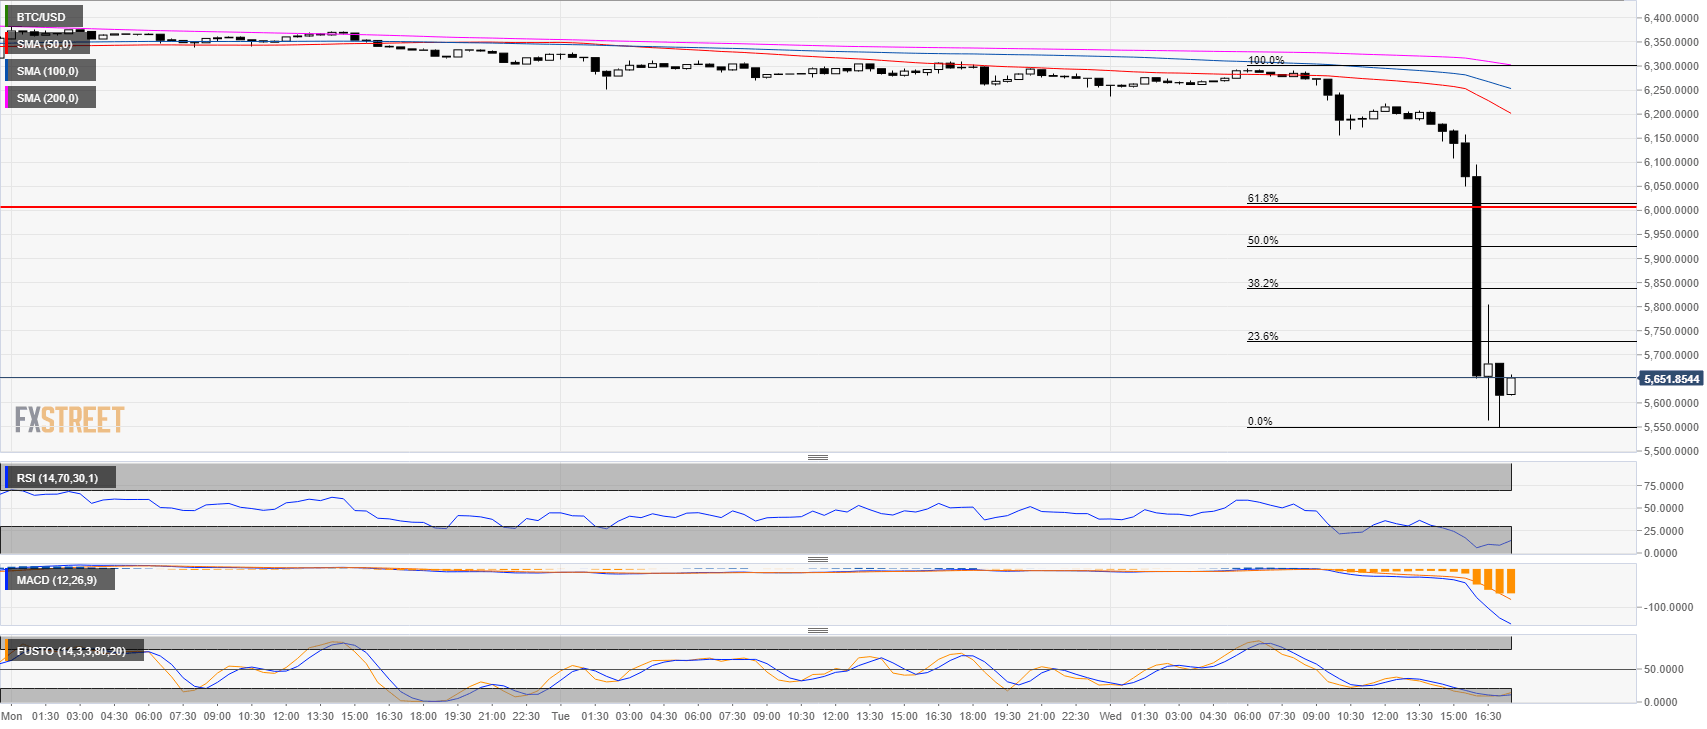
  • On an intraday basis BTC/USD is way oversold, but considering the crash on the higher time frame, any rally should likely be sold into. Resistance levels are seen near 5,900 and the 6,000 level. 

Additional key levels at a glance

BTC/USD

Overview:
    Last Price: 5617.49
    Daily change: -6.4e+4 pips
    Daily change: -10.3%
    Daily Open: 6259.76
Trends:
    Daily SMA20: 6364.22
    Daily SMA50: 6421.06
    Daily SMA100: 6496.84
    Daily SMA200: 6996.42
Levels:
    Daily High: 6327.12
    Daily Low: 6251.2
    Weekly High: 6538.13
    Weekly Low: 6310.18
    Monthly High: 6783.05
    Monthly Low: 6060.88
    Daily Fibonacci 38.2%: 6280.2
    Daily Fibonacci 61.8%: 6298.12
    Daily Pivot Point S1: 6231.6
    Daily Pivot Point S2: 6203.44
    Daily Pivot Point S3: 6155.68
    Daily Pivot Point R1: 6307.52
    Daily Pivot Point R2: 6355.27
    Daily Pivot Point R3: 6383.43

Author

Flavio Tosti

Flavio Tosti

Independent Analyst


More from Flavio Tosti
Share:

Editor's Picks

Hyperliquid Price Forecast: HYPE rises on commodities demand amid US-Iran war

Hyperliquid (HYPE) steadies above $33 at press time on Tuesday, marking its fourth consecutive day of recovery in a broadly volatile market due to the ongoing US-Israel strikes on Iran.

Stellar Price Forecast: XLM risks deeper losses as derivatives metrics turn negative

Stellar is trading red below $0.16 at the time of writing, after a slight recovery the previous day. Weakening derivatives data caps the recovery, while an unfavorable technical outlook projects a deeper correction for the XLM token in the upcoming days.

Aave Price Forecast: AAVE tests channel resistance as ParaFi Capital deposit, bearish derivatives data caps upside

Aave (AAVE) trades around $120 on Tuesday, testing the channel resistance, signaling that sellers remain active in the zone. Lookonchain data shows that ParaFi Capital transferred 42,000 AAVE tokens to Coinbase Prime over the past 10 hours, often interpreted as a potential selling signal.

CME Group's futures suite now covers over 75% of total crypto market cap

CME Group announced that its crypto futures offering now covers over 75% of the total digital asset market cap, following the launch of its Cardano (ADA), Chainlink (LINK) and Stellar (XLM) products.

Bitcoin Price Annual Forecast: BTC holds long-term bullish structure heading into 2026

Bitcoin (BTC) is wrapping up 2025 as one of its most eventful years, defined by unprecedented institutional participation, major regulatory developments, and extreme price volatility.

Bitcoin: Another month of losses, and it’s been five

Bitcoin (BTC) price is stabilizing around $68,000 at the time of writing on Friday, but the Crypto King is poised to close February on a fragile footing, marking its fifth consecutive month of losses since October and a rare start to the year with back-to-back monthly corrections.