Bitcoin Technical Analysis: BTC/USD santa rally mode on
- Bitcoin price on Wednesday enjoying chunky gains of 6% in the sessions, flirting with $4000.
- BTC/USD sees another breakout to the upside from after small consolidation period
- Santa rally appears to be very much in full force across the market.

BTC/USD 15-minute chart
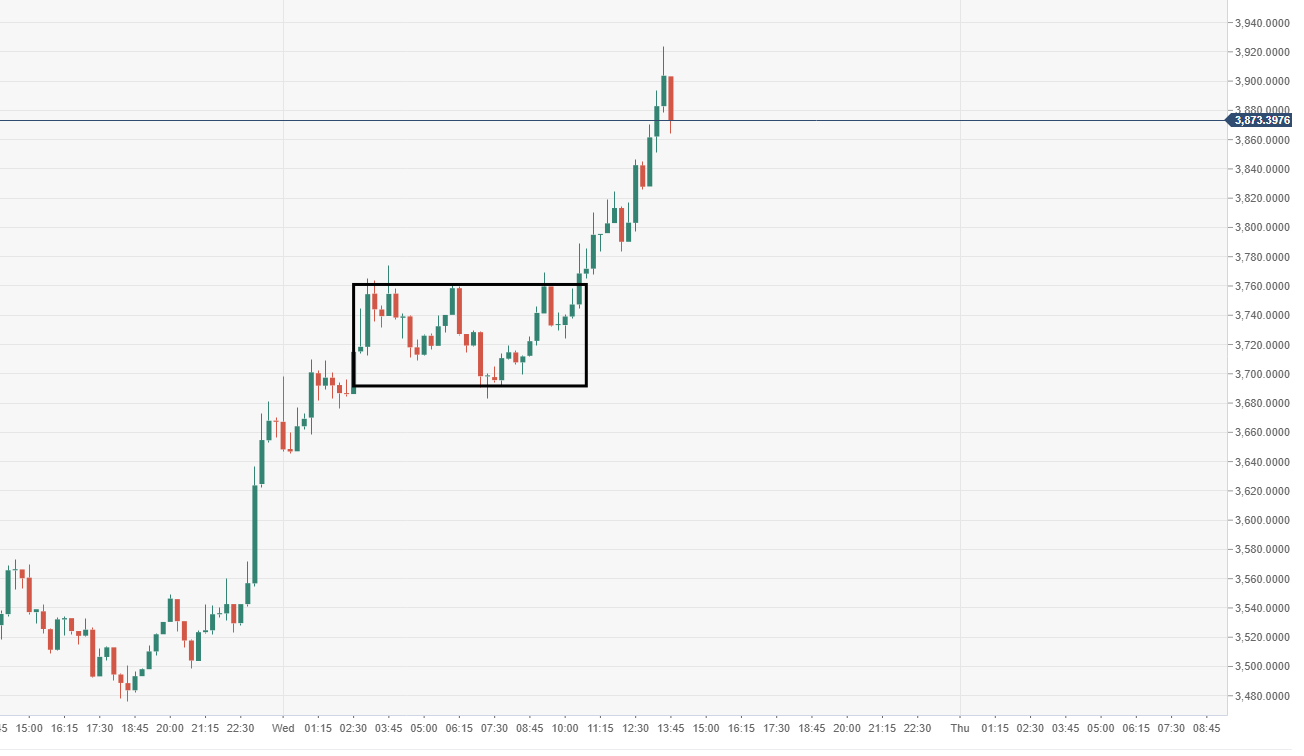
Spot rate: 3864.10
Relative change: +5.23%
High: 3923.98
Low: 3676.58
Trend: Bullish
Resistance 1: 3753.53, daily pivot point resistance.
Resistance 2: 3839.86, daily pivot point resistance.
Resistance 3: 3998.92, daily pivot point resistance.
Support 1: 3508.15, near-term ascending trend line.
Support 2: 3349.09, daily pivot point support.
Support 3: 3262.76, daily pivot point support.
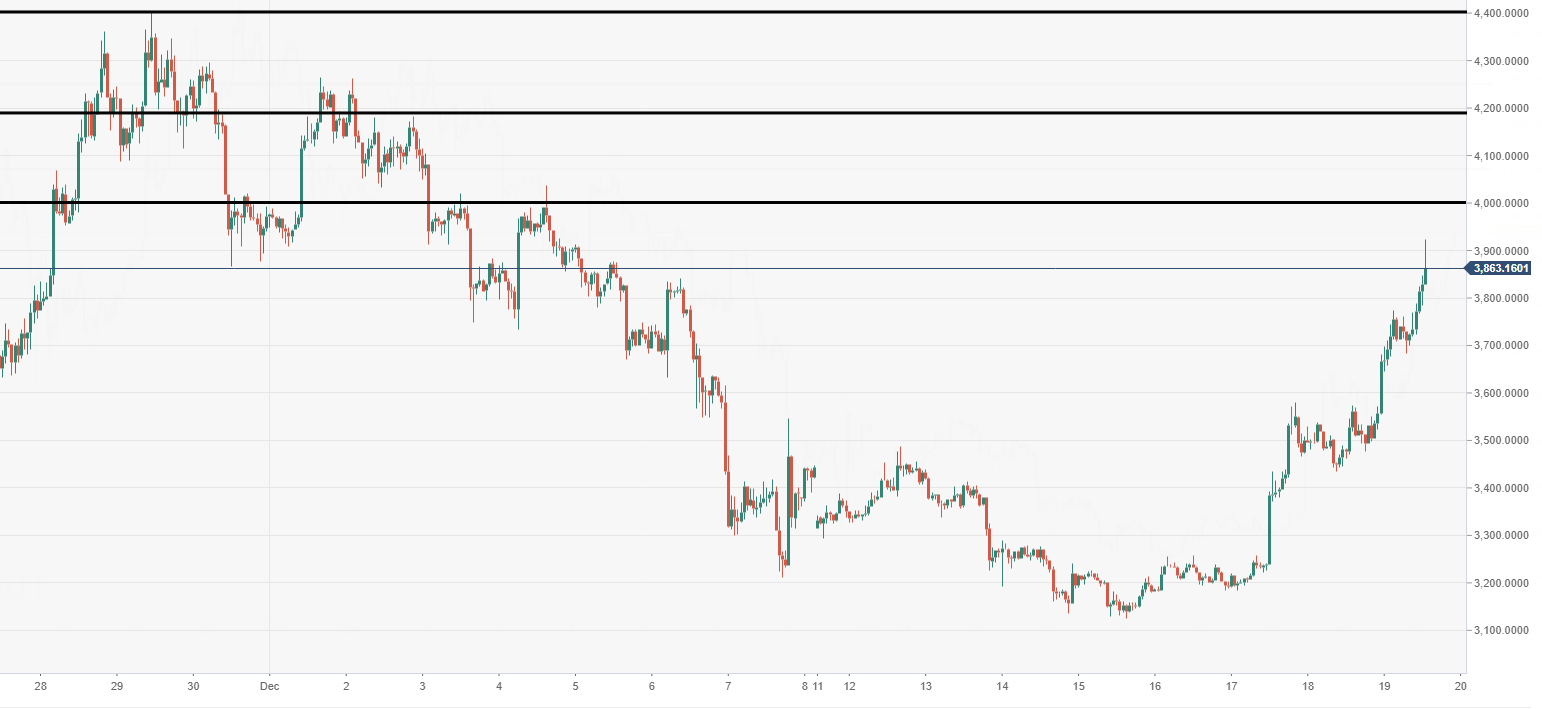
BTC/USD 60-minute chart
- Minor resistance around the $4000 mark, a break above should open door for a move back towards $4500.
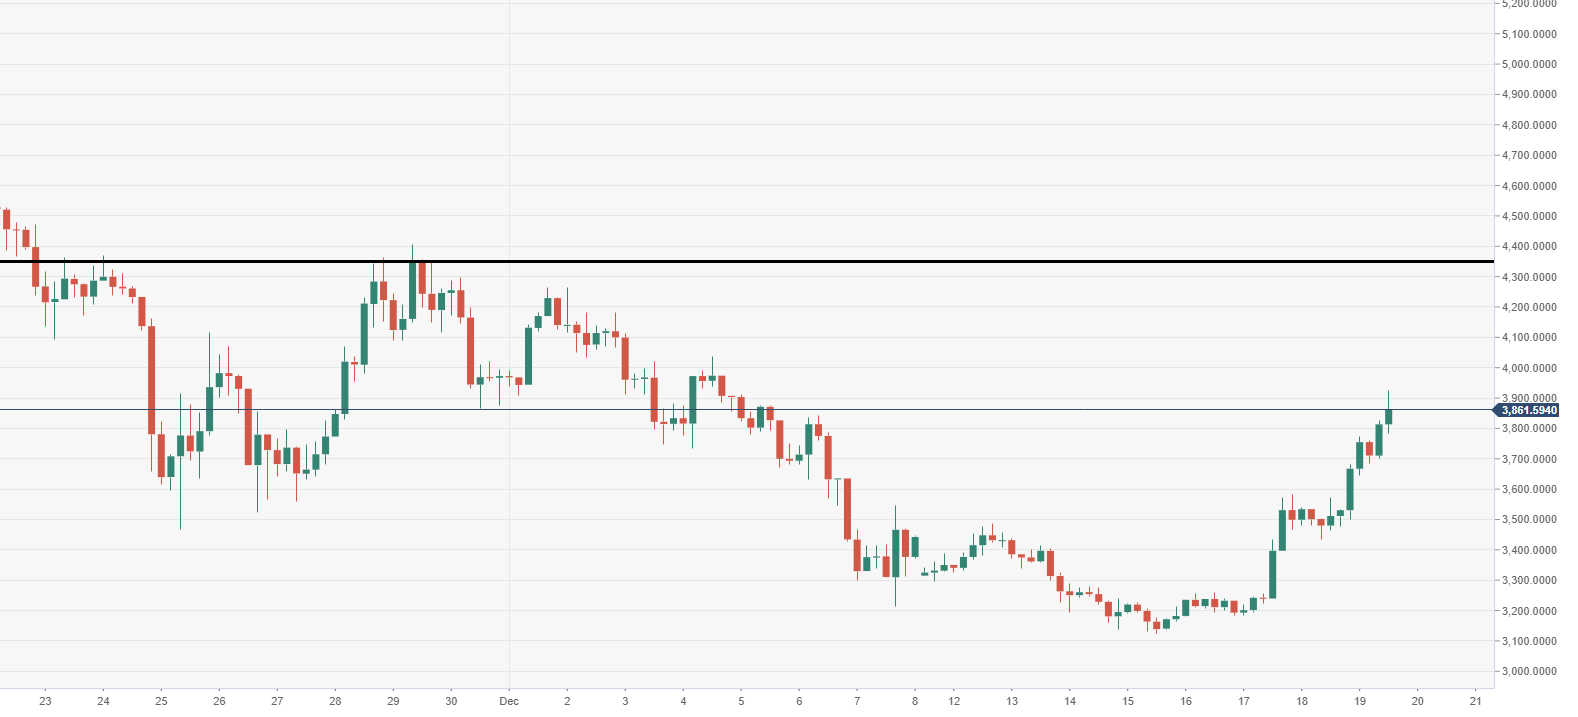
BTC/USD 4-hour chart
- Possibility of an inverted head and shoulders pattern forming via the 4-hour chart.
Author

Ken Chigbo
Independent Analyst
Ken has over 8 years exposure to the financial markets. He started his career as an analyst, covering a variety of asset classes; forex, fixed income, commodities and equities.


