Bitcoin Technical Analysis: BTC/USD remains in dangerous territory, current consolidation mode still spells trouble
- Bitcoin seen down just shy of 1% on Friday, after a brutal week of selling.
- BTC/USD price moving within a narrow range, within a small structured ascending channel.

BTC/USD 60-minute chart
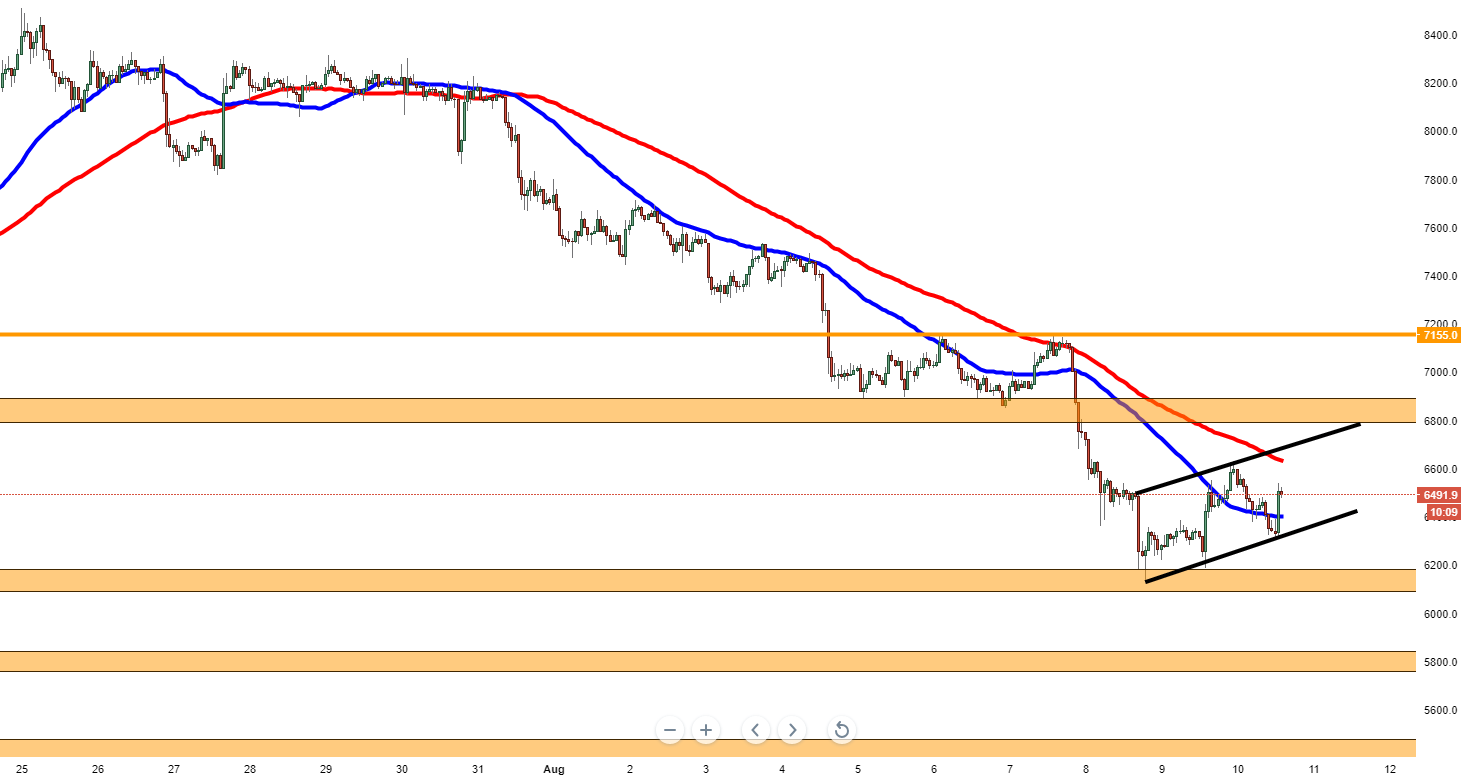
Spot rate: 6499.9
Relative change: -0.5%
High: 6573.8
Low: 6301.0
Trend: Bearish
Support 1: 6396.5, 50MA.
Support 2: 6330.1, lower part of ascending channel.
Support 3: 6170.0, demand zone.
Resistance 1: 6624.6, 100MA.
Resistance 2: 6695.1, upper part of ascending channel.
Resistance 3: 6790.4, supply zone.
Author

Ken Chigbo
Independent Analyst
Ken has over 8 years exposure to the financial markets. He started his career as an analyst, covering a variety of asset classes; forex, fixed income, commodities and equities.
More from Ken Chigbo


