|

Bitcoin Technical Analysis: BTC/USD consolidates around $8,000

BTC/USD Daily Chart

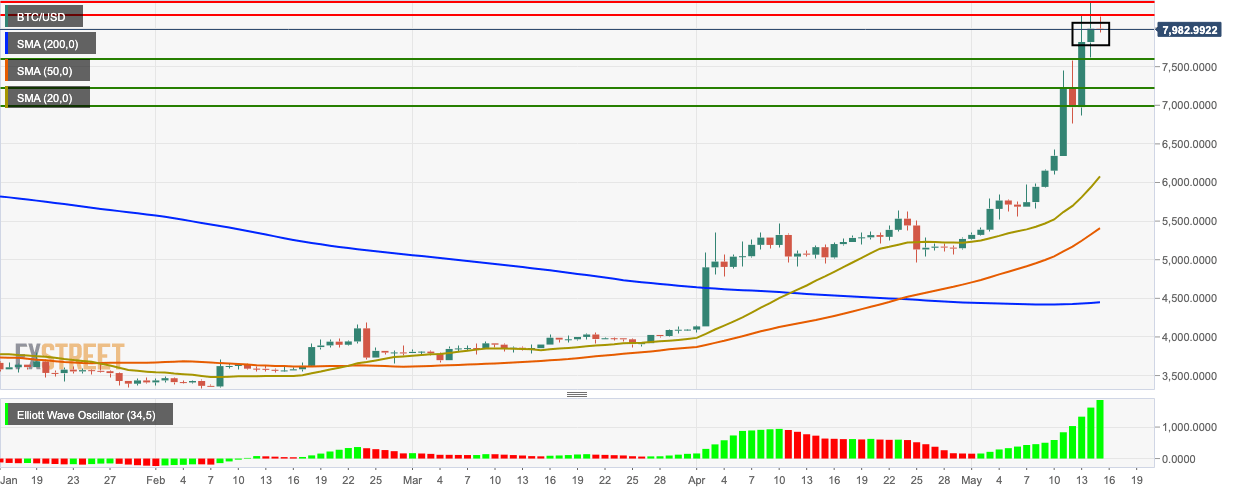
  • BTC/USD is currently trading for $8,020.
  • The bulls will be aiming for the $8,050 level in the short-term.
  • The price is currently consolidating in a flag formation priming for a breakout.
  • BTC/USD is comfortably trading above the SMA 200, SMA 50, and SMA 20 curves.
  • The Elliot wave oscillator shows 14 consecutive bullish sessions.

BTC/USD 4-Hour Chart

  • The 4-hour BTC/USD market has had a bullish outbreak from the triangle formation.
  • The chart overtook the upper curve of the 20-day Bollinger band five sessions back but then crept back inside towards the SMA 20 curve.
  • The price found support on the $7,770 line and bounced back up.
  • The relative strength index (RSI) indicator is creeping next to the overbought territory.

BTC/USD Hourly Chart

  • The hourly price is currently trending inside a cup and saucer pattern.
  • The price found support on the upward trending line and bounced back up.
  • The signal line is converging with the MACD line indicating decreasing bearish momentum.

Key Levels

BTC/USD

Overview
Today last price8039.11
Today Daily Change48.41
Today Daily Change %0.61
Today daily open7990.7
 
Trends
Daily SMA205938.01
Daily SMA505327.12
Daily SMA1004554.22
Daily SMA2004494.32
Levels
Previous Daily High8337.26
Previous Daily Low7623.54
Previous Weekly High6428.2
Previous Weekly Low5564.95
Previous Monthly High5632.53
Previous Monthly Low4052.2
Daily Fibonacci 38.2%8064.62
Daily Fibonacci 61.8%7896.19
Daily Pivot Point S17630.4
Daily Pivot Point S27270.11
Daily Pivot Point S36916.68
Daily Pivot Point R18344.13
Daily Pivot Point R28697.56
Daily Pivot Point R39057.85

Author

Rajarshi Mitra

Rajarshi Mitra

Independent Analyst

Rajarshi entered the blockchain space in 2016. He is a blockchain researcher who has worked for Blockgeeks and has done research work for several ICOs. He gets regularly invited to give talks on the blockchain technology and cryptocurrencies.

More from Rajarshi Mitra
Share:

Editor's Picks

Ripple Price Forecast: XRP potential bottom could be in sight

Ripple edges up above the intraday low of $1.35 at the time of writing on Friday amid mixed price actions across the crypto market. The remittance token failed to hold support at $1.40 the previous day, reflecting risk-off sentiment amid a decline in retail and institutional sentiment. 

Crypto Today: Bitcoin, Ethereum, XRP in choppy price action, weighed down by falling institutional interest 

Bitcoin holds above support at $65,118 at the time of writing on Friday. Ethereum remains choppy in a narrow range between support at $1,900 and resistance at $2,000, while Ripple attempts another upward move toward the pivotal $1.40 level.

PancakeSwap Price Analysis: Bearish momentum suggests further downside

PancakeSwap (CAKE) is trading below $1.26 at the time of writing on Friday, extending the losses by over 8% so far this week. The weakening derivatives market further supports the bearish outlook, with bears aiming for levels below $1.18.

Decred Price Forecast: DCR rebounds toward key resistance zone on volume spike

Decred (DCR) rebounds over 7% at press time on Friday after a three-day decline of almost 14%. Roughly 60% increase in trading volume over the last 24 hours supports the recovery, suggesting heightened spot-market demand. 

Bitcoin Price Annual Forecast: BTC holds long-term bullish structure heading into 2026

Bitcoin (BTC) is wrapping up 2025 as one of its most eventful years, defined by unprecedented institutional participation, major regulatory developments, and extreme price volatility.

Bitcoin: BTC bears aren’t done yet

Bitcoin (BTC) price slips below $67,000 at the time of writing on Friday, remaining under pressure and extending losses of nearly 5% so far this week.