Bitcoin Technical Analysis: BTC/USD bulls given consolation run
- Bitcoin price on Wednesday trading in the green with modest gains of just 2% into the second half of the day.
- BTC/USD giving a consolation run, as sellers temporarily run exhausted.
- Current momentum observed from the bull camp does not look convincing at this time.

BTC/USD 15-minute chart
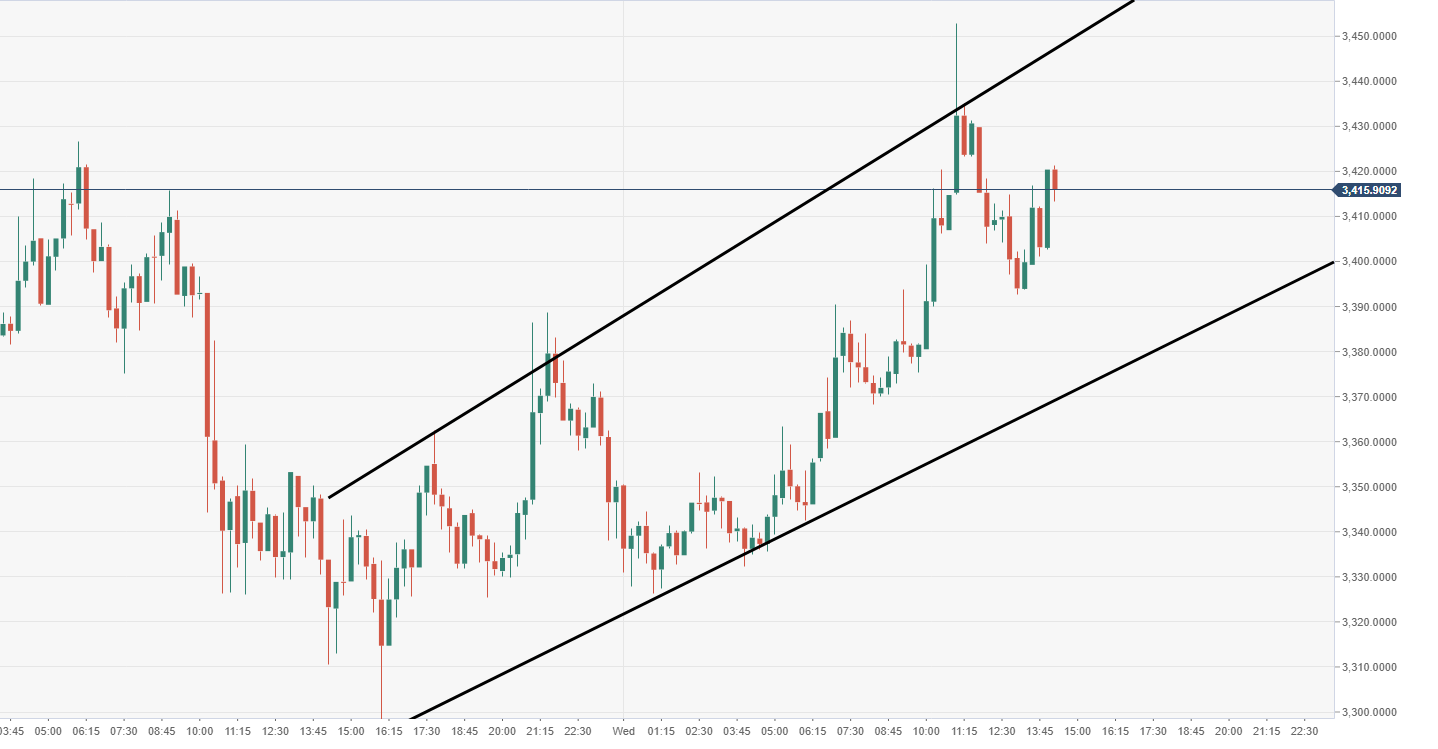
Spot rate: 3419.01
Relative change: +2.12%
High: 3452.95
Low: 3326.27
Trend: Bearish
Support 1: 3370.00, lower part of wedge (15-minute).
Support 2: 3224.58, daily pivot point support.
Support 3: 3154.94, daily pivot point support.
Resistance 1: 3419.62, 15-minute resistance, near-term top.
Resistance 2: 3489.26, daily pivot point resistance.
Resistance 3: 3551.95, daily pivot point resistance.
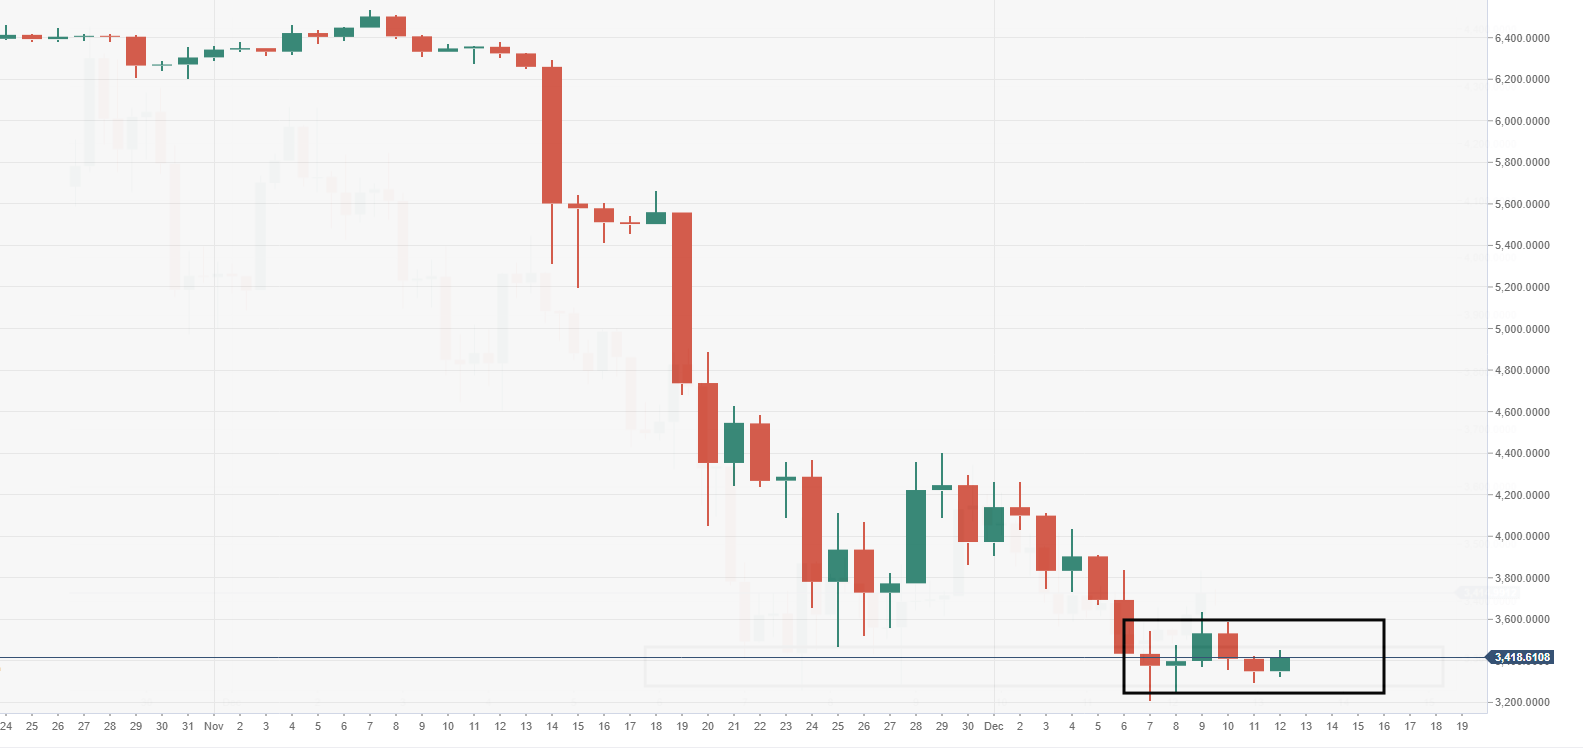
BTC/USD 4-hour chart
- Big near-term demand area propping up the price around the $3200-300 region.
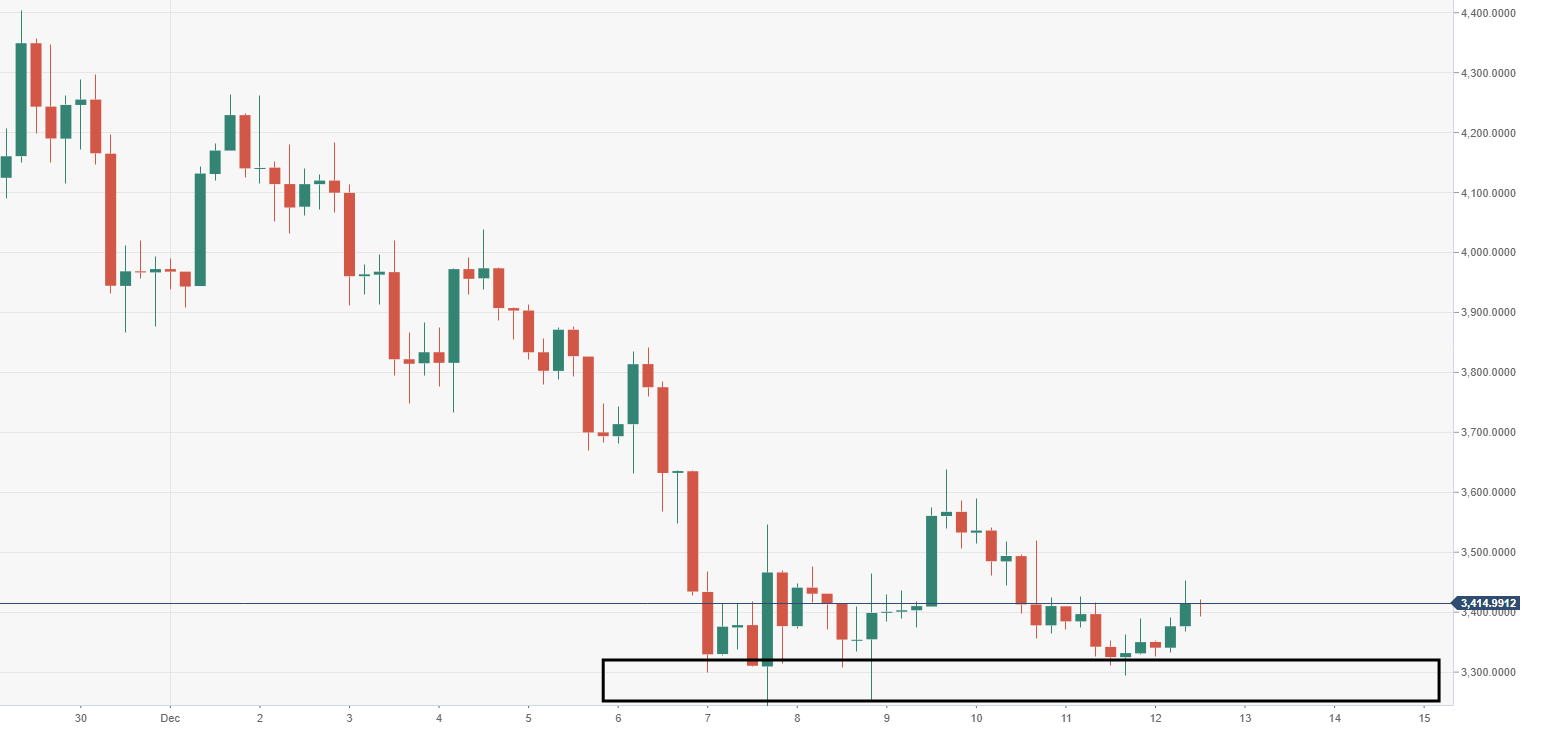
BTC/USD daily chart
- Price moving within a stubborn range, suck within a high of $3600 down to a low of $3200.
Author

Ken Chigbo
Independent Analyst
Ken has over 8 years exposure to the financial markets. He started his career as an analyst, covering a variety of asset classes; forex, fixed income, commodities and equities.


