Bitcoin Technical Analysis: BTC/USD backing into $6,000
- Bitcoin's pattern of cyclical bidding shocks appears to have ended, and is now heading in the opposite direction.
- BTC traders are seeing prices slump back towards the 6,000.0 major level.
- Bitcoin has struggled to develop a bullish trend in 2018, and highs continue to drop lower on Daily candles.

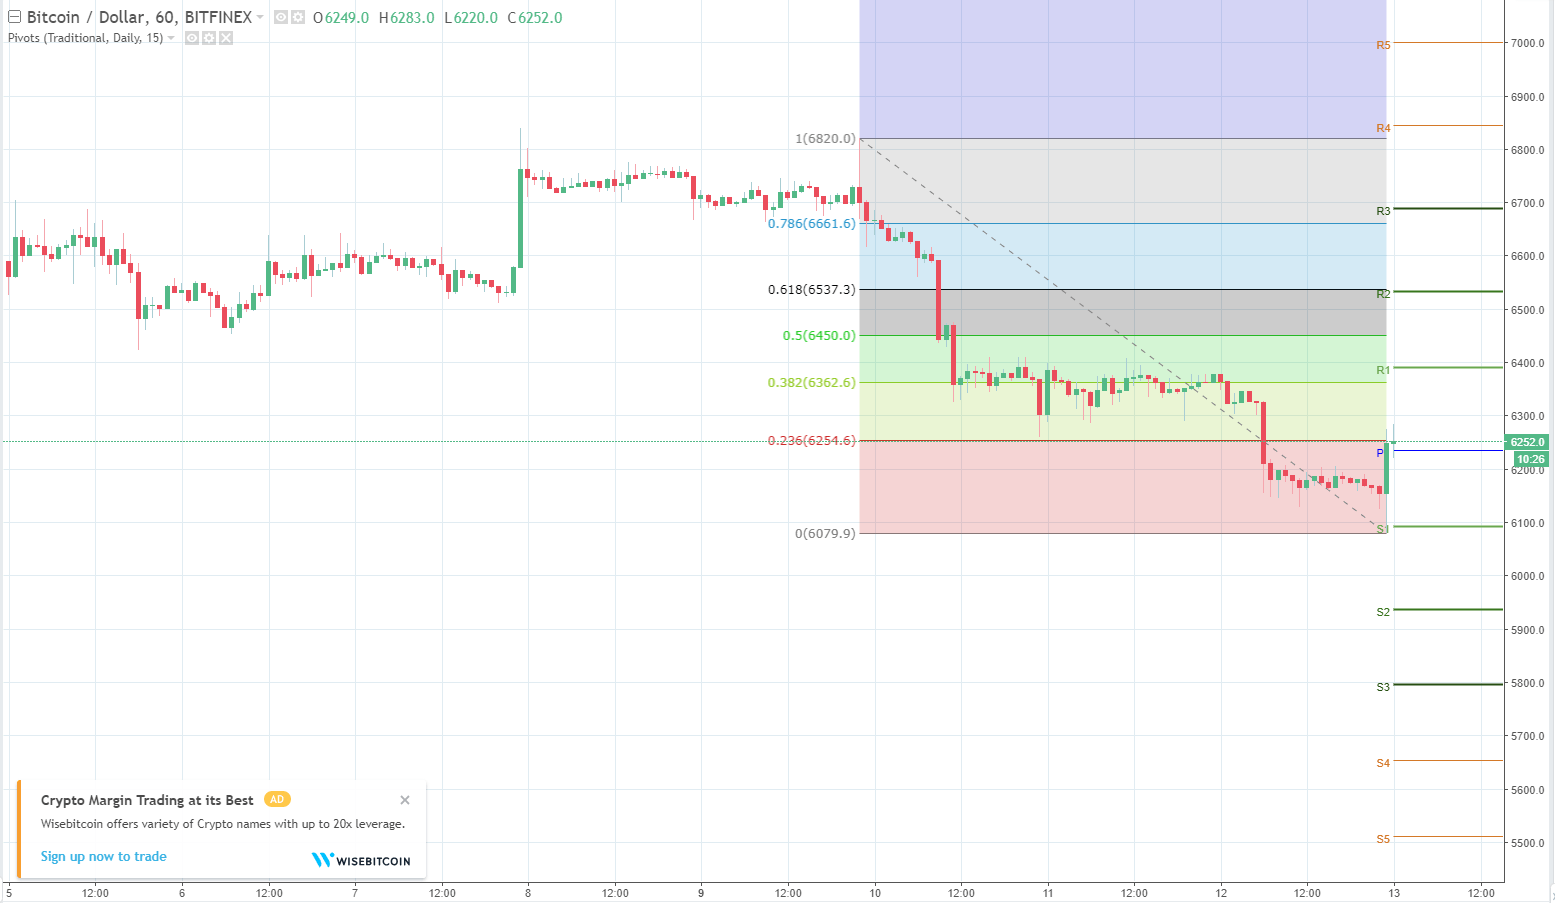
| Spot rate: | 6252.0 |
| Relative change: | Negligible |
| High: | 6283.0 |
| Low: | 6220.0 |
| Trend: | Bearish |
| Support 1: | 6080.0 (current week low) |
| Support 2: | 5936.0 (S2 daily pivot) |
| Support 3: | 5796.0 (S3 daily pivot) |
| Resistance 1: | 6395.0 (June 11th swing high) |
| Resistance 2: | 6537.0 (61.8% Fibo retracement level) |
| Resistance 3: | 6820.0 (two week high) |
Author

Joshua Gibson
FXStreet
Joshua joins the FXStreet team as an Economics and Finance double major from Vancouver Island University with twelve years' experience as an independent trader focusing on technical analysis.
More from Joshua Gibson


