Bitcoin Technical Analysis: BTC/USD big bull run continues, as price charges ahead, with buying returning to the market, jumping 6%
- Bitcoin price has run riot on Tuesday, gaining as much as 6% in the early part of the session.
- BTC/USD extending its move to the north, following the breakout on Monday from a bull flag pattern.
- Next major area of interest will be seen around the $9500 territory, last traded here in May.

BTC/USD 4-hour chart
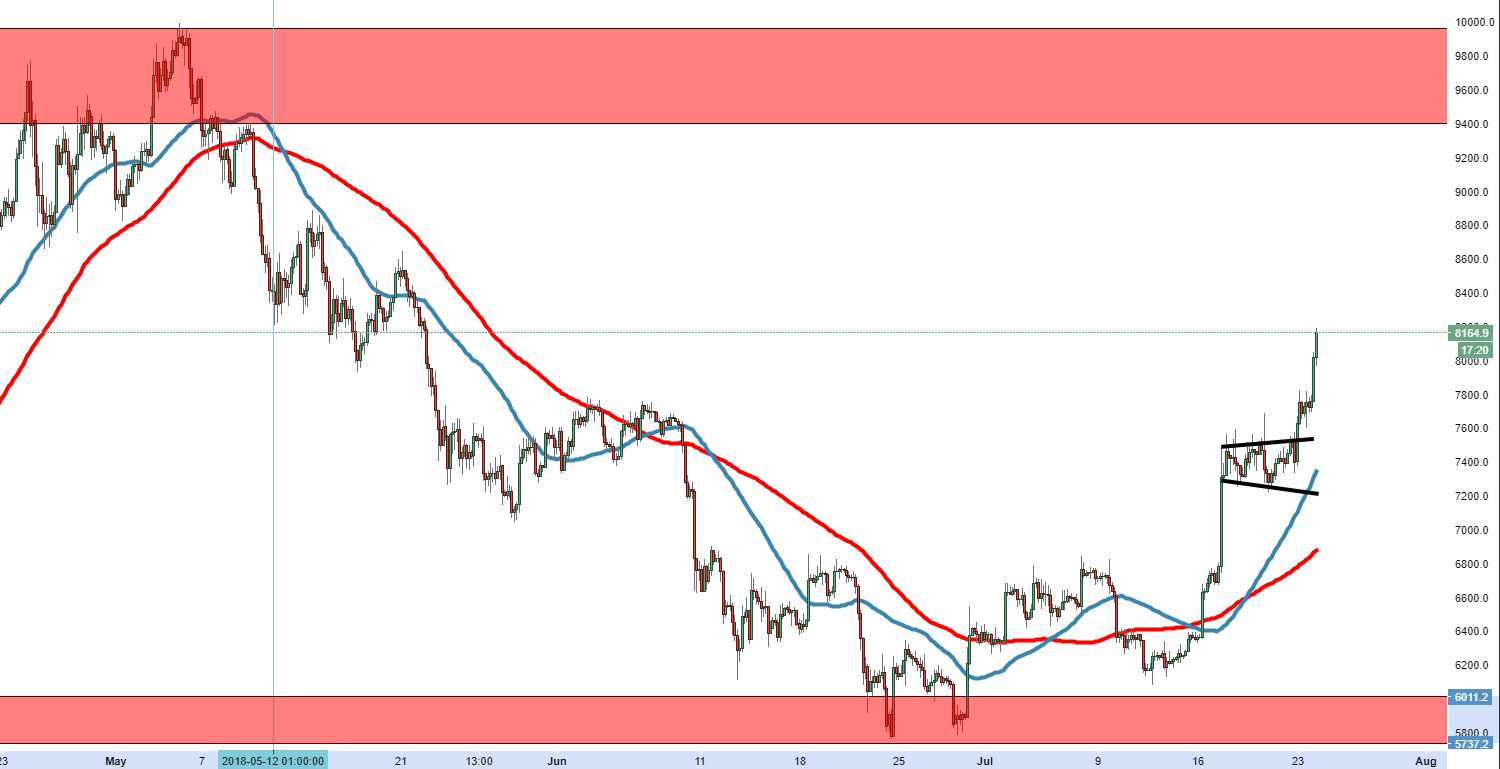
Spot rate: 8230.0
Relative change: +6.71%
High: 8238.2
Low: 7690.0
Trend: Bullish.
Resistance 1: 8278.0, consolidation area 18th May.
Resistance 2: 8360.9, (resistance on 4-hour chart), consolidation area 17th May,
Resistance 3: 8473.4, 17th & 19th May high.
Support 1: 7751.1, 7th June high and supply area.
Support 2: 7544.0, on top of broken bull flag pattern.
Support 3: 7360.4, 50MA and demand area.
Author

Ken Chigbo
Independent Analyst
Ken has over 8 years exposure to the financial markets. He started his career as an analyst, covering a variety of asset classes; forex, fixed income, commodities and equities.


