Bitcoin start triangle after massive uptrend breaks $40k

BTC/USD (Bitcoin) has broken above the $40,000 resistance zone after an exceptionally strong move up. Is the trend overstretched? Let’s review the wave and chart patterns.
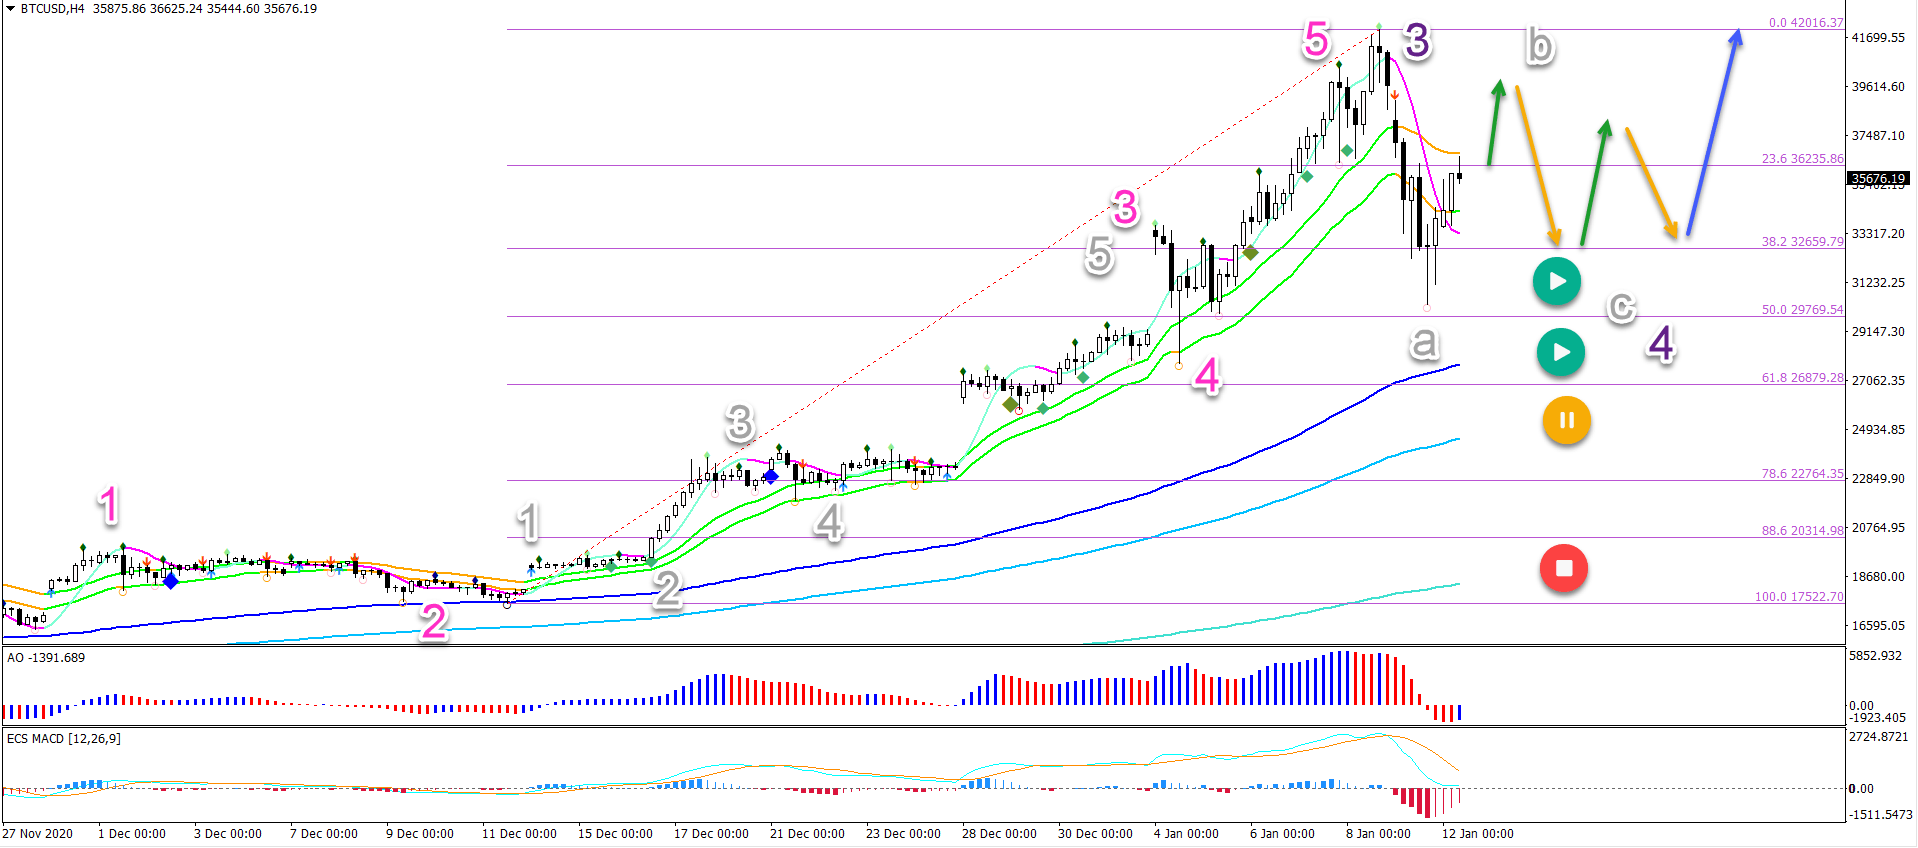
That said, the counter trend decline did reach the 50% Fibonacci retracement level. This could indicate a deep or longer retracement via an ABC correction or ABCDE triangle.
Price Charts and Technical Analysis
The BTC/USD is not showing any significant signs of a reversal. There is no divergence on the 4 hour chart or higher time frames. Also, the momentum up is very strong.
As long as price stays above the 50-61.8% Fibonacci support zone, an uptrend has the best chance of continuing higher (blue arrow) for new high. Only a break below the deep Fibonacci levels would change and invalidate that view.
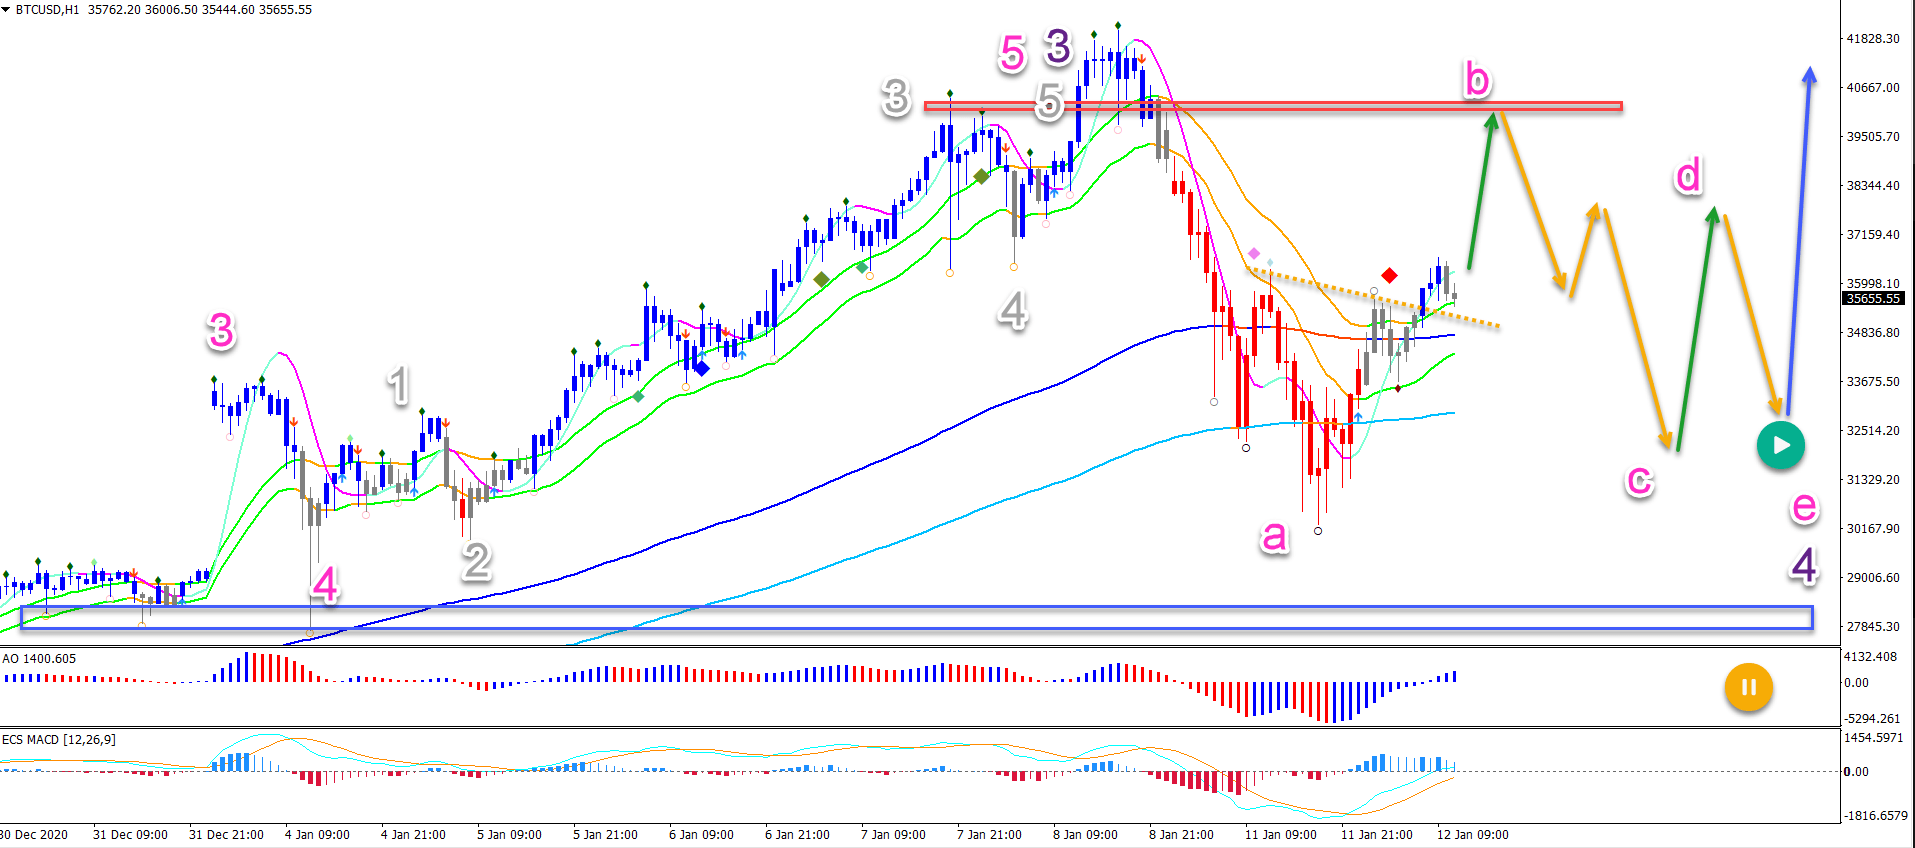
On the 1 hour chart, price action seems to have completed a wave A (pink) of a wave 4 (purple) correction. The wave could become numerous different types of corrections:
-
ABC flat.
-
ABCDE triangle.
-
ABC zigzag.
The first two options are the most likely scenarios. This means that a deeper retracement towards the resistance and then a bounce back down is the most likely pattern.
The analysis has been done with the ecs.SWAT method and ebook.
Author

Chris Svorcik
FS method
Chris Svorcik is a trader, analyst, and educator with over 15 years of experience in financial markets, specializing in moving averages, market structure, and price patterns.


