Bitcoin set for volatile monthly close after BTC price 'checks all boxes' for major move

Bitcoin (BTC) has reentered its most significant lifelong consolidation zone but could still crash to a “macro bottom,” new research warns.
In a Twitter thread on April 27, on-chain analytics platform Material Indicators shone a light on the importance of $38,000 for BTC price action.
Bitcoin circles all-important point of control
After lingering near liquidity at or above $37,700 on intraday timeframes, data from Cointelegraph Markets Pro and TradingView shows, BTC/USD has yet to make a clear move up or down, and traders have been left guessing which way the market will go.
Macro factors are demanding further downside, as the impact of inflation and geopolitical strife is clearly felt on equities markets.
At the same time, on-chain signals are anything but bearish, led by miners and their ever-increasing investment in hash rate.
Whether short or long timeframe, however, $38,000 forms a critical historical price for Bitcoin.
“Since the breakout from $20k in Dec '20, BTC has consolidated in this range more than any other,” Material Indicators explained.
It added that the “point of control” — essentially the price level with the highest volume — now sits at “precisely” where spot price is currently acting.
Where Bitcoin could go from here, however, is not obvious given this month’s price trend. Analyzing the 3-day chart, Material Indicators noted both bullish and bearish patterns repeating themselves this week alone.
These involve the 50-period, 100-period and 200-period moving averages on the 3-day chart.
“Zooming in slightly to the 3 Day chart reveals that 3-Day 50MA crosses below the 100 3-Day MA have triggered rallies and interaction with the 3-Day 200 MA has either led to a rally or breakdown to the macro bottom,” it noted.
BTC has checked all of those boxes this week.
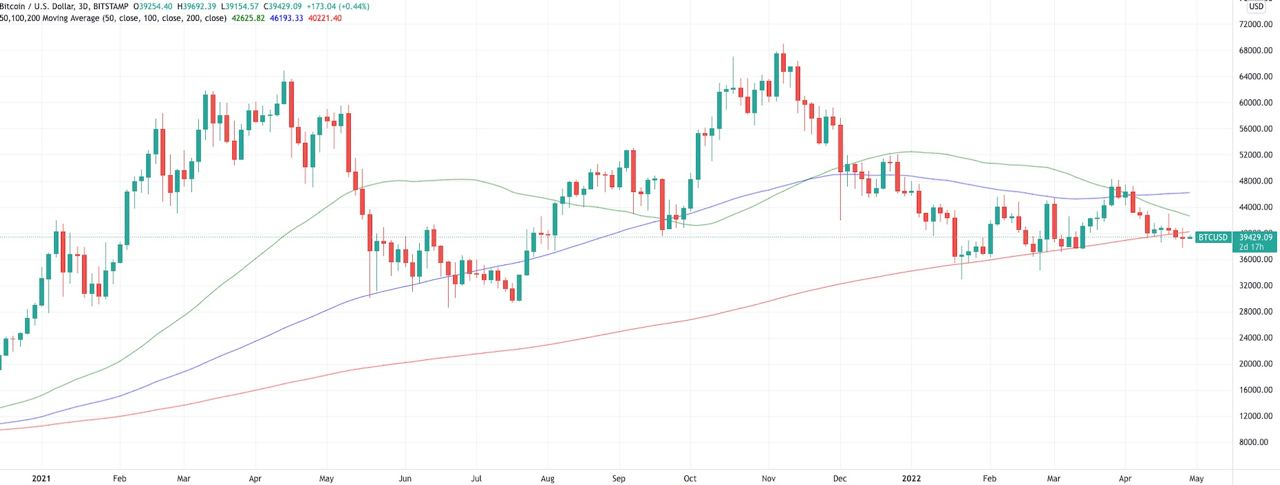
BTC/USD 3-day candle chart (Bitstamp) with 50, 100, 200 MA. Source: TradingView
Lost moving averages stack up
Regardless of direction, volatility is all but guaranteed thanks to the upcoming monthly close. At present, BTC/USD is set to close April $6,000 lower than where it started.
As Cointelegraph previously reported, the weekly chart produced the first four-period red candle set since June 2020 on last Sunday’s close.
Two key weekly moving averages meanwhile repeated a rare trend, which twice sparked a 50% BTC price drawdown this week.
Concluding, Material Indicators brought whales into the picture. In addition to now lying below all three aforementioned moving averages, whale buying and selling behavior at this crucial point is key to determining future trajectory.
“Until BTC reclaims the key moving averages these are considered distribution rallies used to sell the rip or add to short positions,” it wrote.
Expect more volatility coming into the Monthly close/open. Will look for a new Trend Precognition signal on the Monthly chart then.
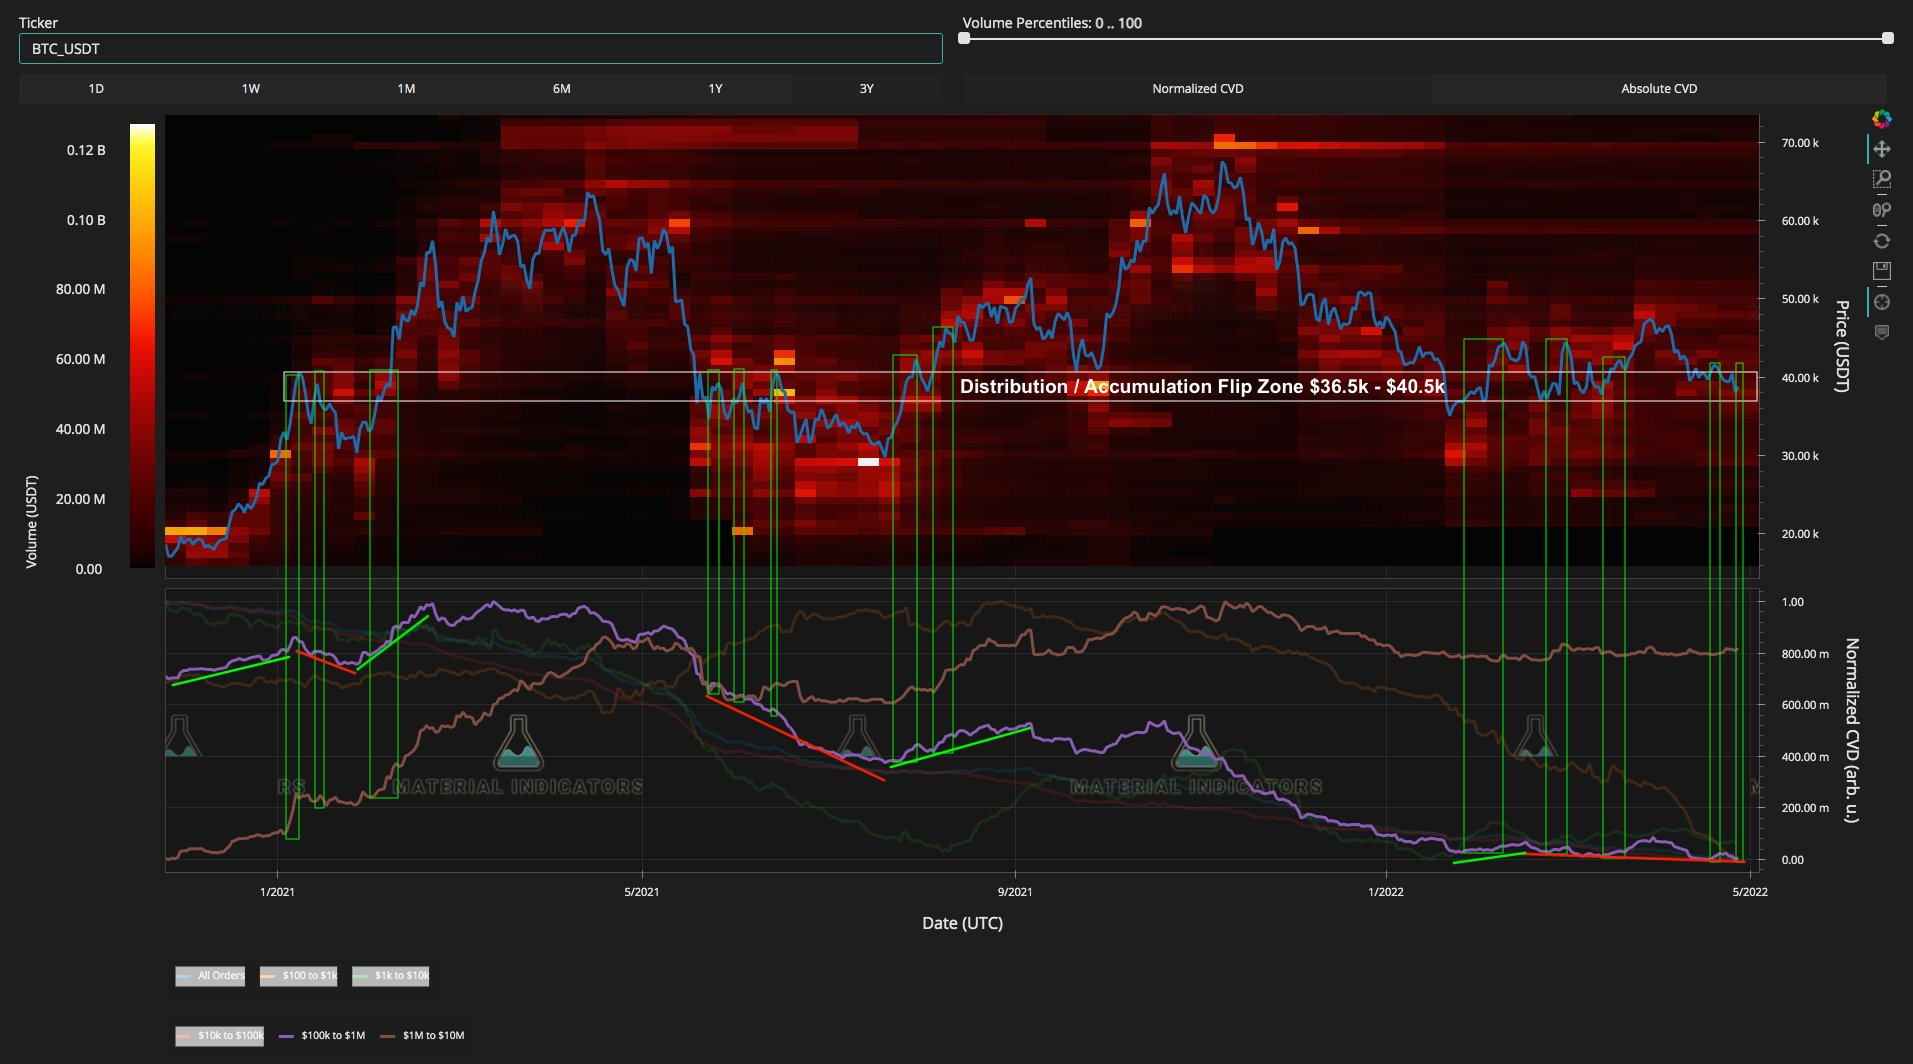
BTC/USD order book chart (Binance) with key whale zone highlighted. Source: Material Indicators/ Twitter
Author

Cointelegraph Team
Cointelegraph
We are privileged enough to work with the best and brightest in Bitcoin.


