Bitcoin, Ripple, Ethereum Overview: Quiet climb built on solid foundations and could turn to a bullish rally – Confluence Detector
- Cryptos continue trading in narrow ranges, but an uptrend is emerging.
- Bitcoin and Ethereum enjoy solid support, while Ripple lags behind.
- Here are the levels to watch according to the Confluence Detector.

Cryptocurrencies are moving in a quiet fashion, but the Bitcoin, the leading cryptocurrency, finally seems comfortable above $4,000. And for a change, BTC/USD is the leader and not being dragged by Ethereum as it happened in previous events.
Both the grandaddy of digital coins and ETH/USD enjoy strong support and may begin rallying. Ripple is somewhat lagging behind.
This is what the Crypto Confluence Detector shows in its latest update:
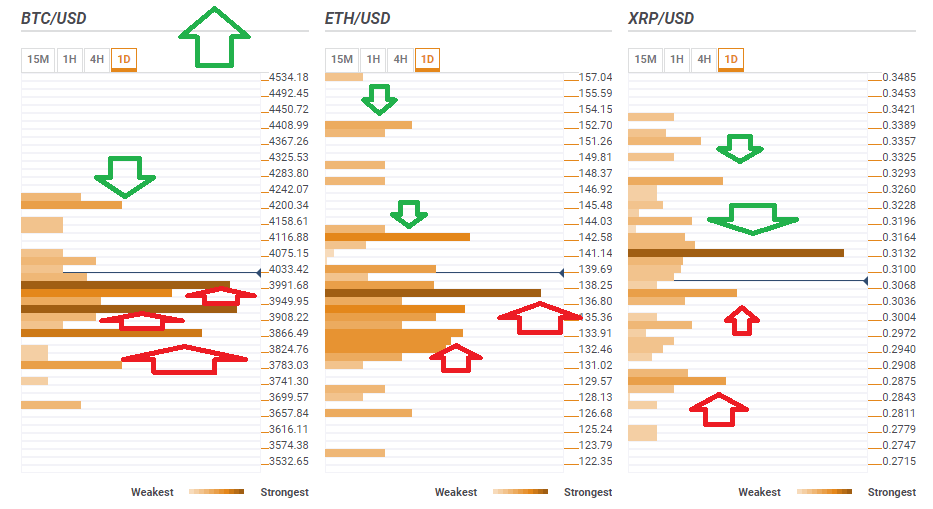
BTC/USD enjoys multiple support clusters
Bitcoin enjoys significant support at $3,991 where we see a dense cluster including the Simple Moving Average 200-1h, the Fibonacci 38.2% one-week, the SMA 50-4h, the Pivot Point one-day Resistance 3, the Bollinger Band 15min-Lower, the Fibonacci 23.6% one-month, and the SMA 50-15m.
Close by, at $3,938, BTC/USD has another significant support line. We see the convergence of the Fibonacci 38.2% one-day, the PP one-week, S1, the Fibonacci 23.6% one-day, the previous weekly low, the previous daily high, and the BB one-day Middle.
Lower, $3,866 is the confluence of the PP one-week S2, the PP one-week S3, the Fibonacci 161.8% one-day, the Fibonacci 38.2% one-month, and the PP one-day S2.
Looking up, resistance lines are not as substantial. At $4,200 the PP one-week R3 meets the previous monthly high. And afterward, there is no resistance until at least $4,534.
ETH/USD has stable support and short-term upside target
Ethereum, like Bitcoin, has strong support in the immediate downside. At $137.50 we see juncture including the BB 1h-Middle, the BB one-day Middle, the SMA 200-1h, the SMA 50-4h, the Fibonacci 38.2% one-week, the SMA 10-1d, and the PP one-day R3.
Another cushion awaits at $134 which is the confluence of the Fibonacci 61.8% one-day and the previous weekly low.
ETH/USD has immediate resistance is close, at $142.50, which is the convergence of the PP one-week R1, the Fibonacci 38.2% one-month, and last month's high.
Further up, $152 is the meeting point of the Fibonacci 23.6% one-month and the PP one-week R3.
XRP/USD needs to break above $0.3132
Ripple is the worst position in the top three cryptocurrencies. It faces a minefield of resistance lines at $0.3132 where the Fibonacci 61.8% one-month, the Fibonacci 38.2% one-week, the SMA 10-1d, the BB 4h-Upper, the BB 1h-Upper, the SMA 50-1d, and the SMA 100-4h all come together.
Further above, $0.3275 is the convergence of the Fibonacci 38.2% one-month, the SMA 100-1d, the PP one-day R3, and the BB one-day Upper.
Support awaits at $0.3050 which is the confluence of the BB 1d-Lower, the previous weekly low, the BB 4h-Middle, the SMA 5-4h, and the BB 1h-Middle.
The next support line is at $0.2875 and it is where we see the Pivot Point one-month S1 and the previous daily low converge.
Author

Yohay Elam
FXStreet
Yohay is in Forex since 2008 when he founded Forex Crunch, a blog crafted in his free time that turned into a fully-fledged currency website later sold to Finixio.