Bitcoin price wants to break past $20,000 while sidelined investors wait for 30% correction
- Bitcoin price remains trading above $19,000, awaiting a clear breakout or breakdown.
- Several on-chain metrics suggest Bitcoin is poised for a big move above $20,000.

Bitcoin has been trading inside a tight range between $18,500 and $20,000 for the past week, trying to create a clear breakout or breakdown. It seems that many on-chain metrics are in favor of Bitcoin price, while patient investors still wait for a potential 30% correction.
Bitcoin price eying up to $20,000 as the next price target
According to recent statistics from Glassnode, it seems that around 10% of Bitcoin’s total supply was moved at a price of $18,000 or higher. This indicates that investors are interested in the digital asset even at a price of $18,000 or above.
Around 10% of the #Bitcoin supply was moved at a price above $18,000.
— glassnode (@glassnode) December 6, 2020
Many investors are valuing BTC above this level, which may indicate their conviction for further $BTC price appreciation.
In contrast: In 2017 at ATH this number was only 2%.
Chart: https://t.co/jrq9kjut6j pic.twitter.com/IdDizGNtxK
Most importantly, during the bull rally in 2017 when Bitcoin hit its all-time high, this number was only 2%, which is a significant difference. Additionally, Jarvis Labs, an artificial intelligence system that analyzes network statistics, notes that the miner reserves have started going sideways during this bull rally.
1/3 Bitcoin Miner Reserve Thread
— JarvisLabs (@Jarvis_Labs_LLC) December 7, 2020
In 2018, the miner reserves started declining. The BCH hard fork in November led to the capitulation of many small miners and also led to a 50% price drop on BTC and a larger drop on ETH. pic.twitter.com/B8AXnG28Za
Apparently, back in 2019, the same trend was observed, which led to Bitcoin price jumping from $4,000 to $14,000. At the same time, popular and prominent investors like Kevin O’Leary state that an SEC-approved Bitcoin ETF would be exciting.
The star of the popular TV show, Shark Tank, has recently stated that he is ready to put around 5% of his investment portfolio in a Bitcoin ETF approved by the SEC. Billionaire Hedge Fund Manager Paul Tudor Jones has said that Bitcoin’s total market capitalization should grow beyond $500 billion in the near term, adding:
Bitcoin reminds me so much of the internet stocks of 1999 because the internet was in its infancy. No one knew how to value it because of the world of possibilities that lay ahead.
Bitcoin price analysis: Key levels to watch out for
On a shorter time-frame, like the 4-hour chart, Bitcoin price has established a descending triangle pattern, which still has a lot of room to expand. A breakout above the upper trendline would currently push BTC towards $20,400, setting a new all-time high.
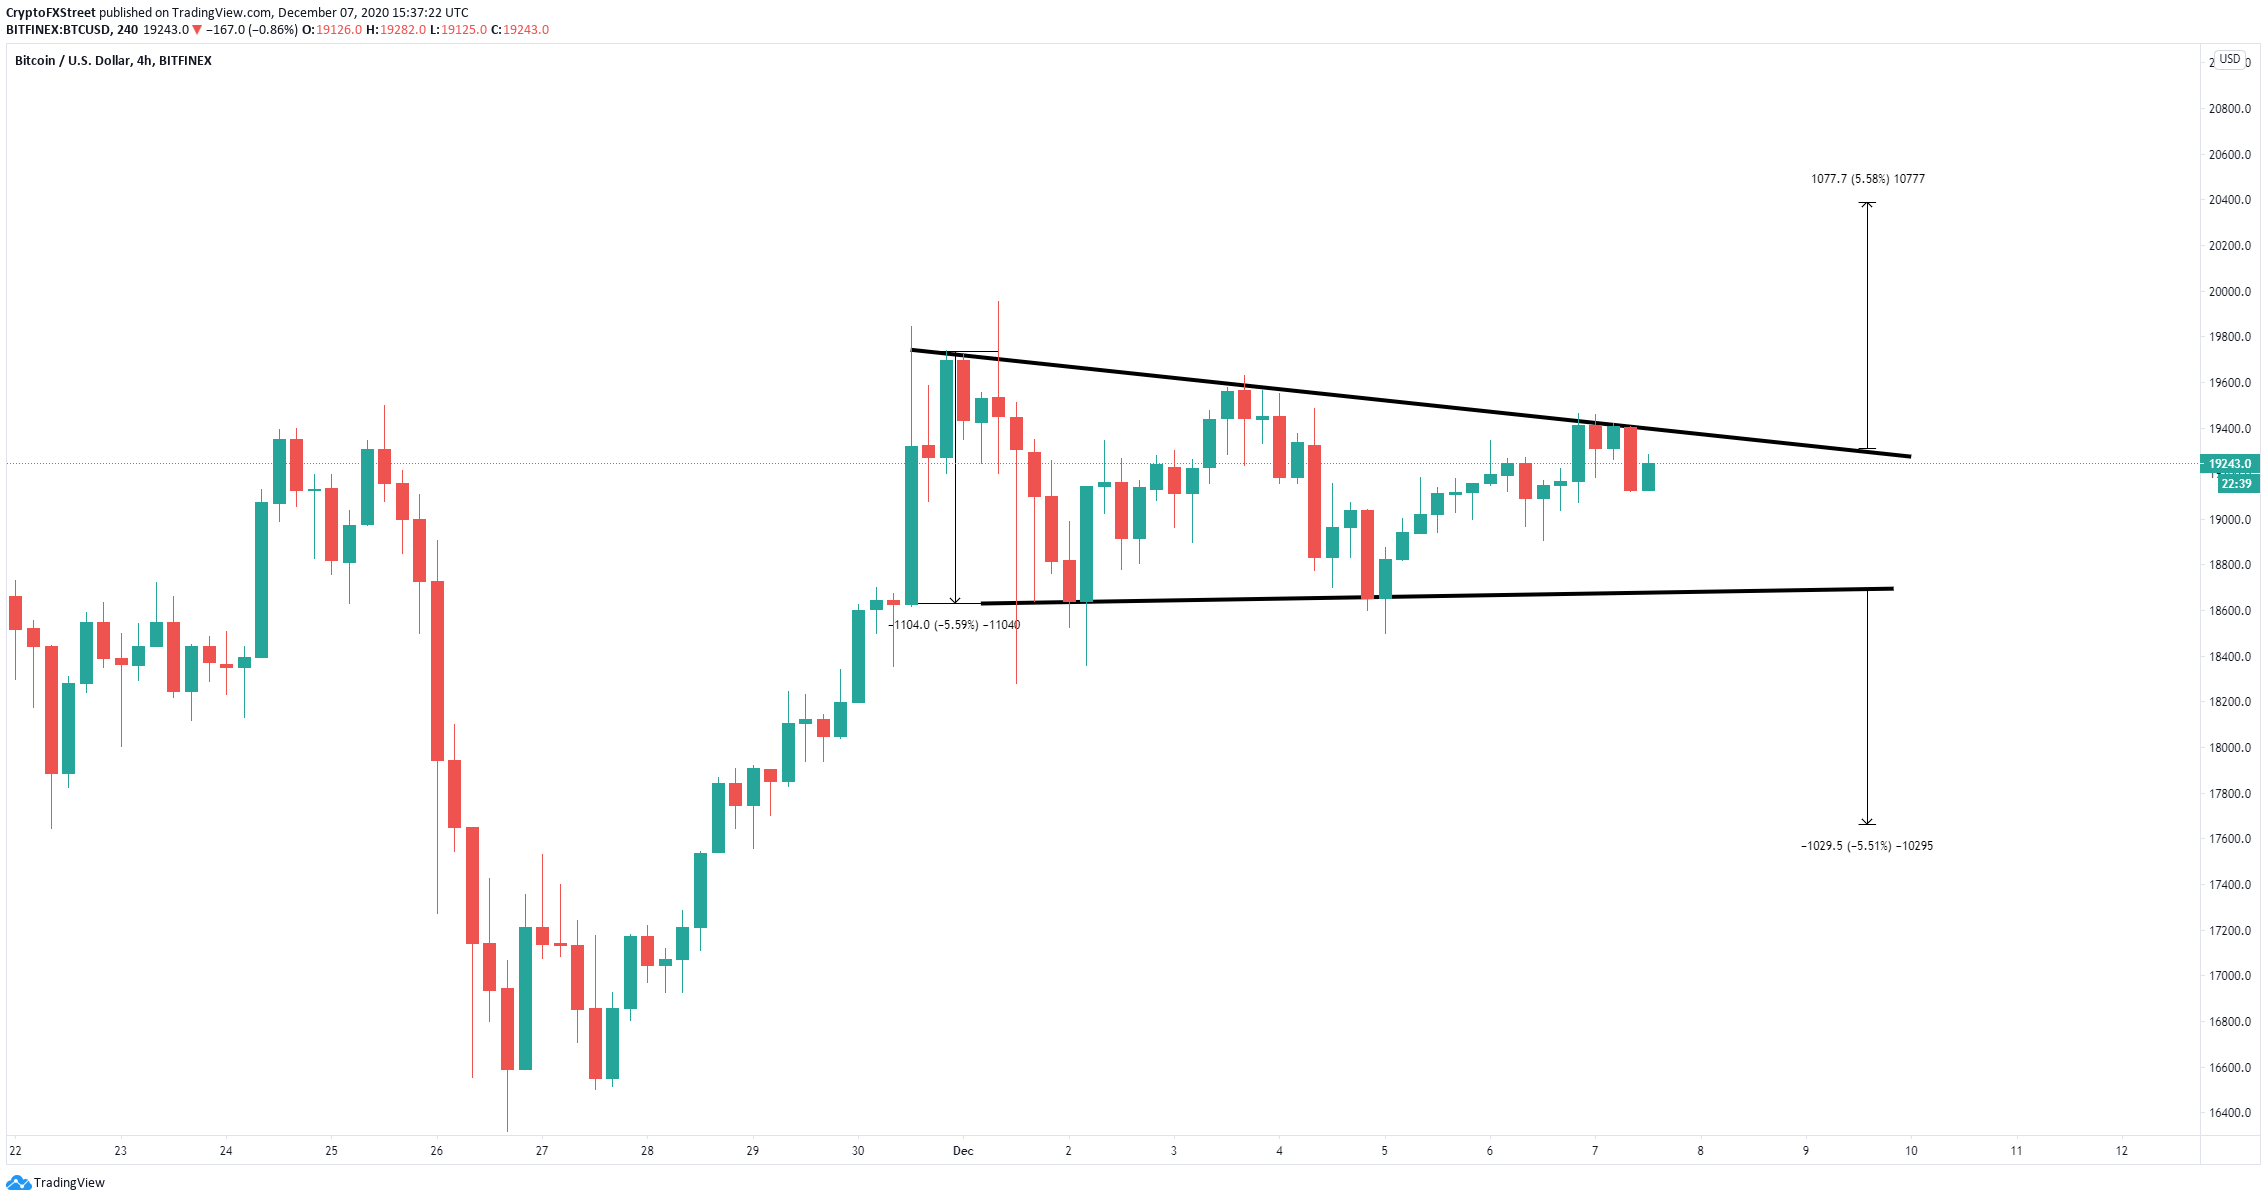
BTC/USD 4-hour chart
It’s also important to note that the In/Out of the Money Around Price (IOMAP) chart shows practically no resistance to the upside and a robust support area between $18,667 and $19,228, where 1.54 million addresses purchased 870,280 BTC.
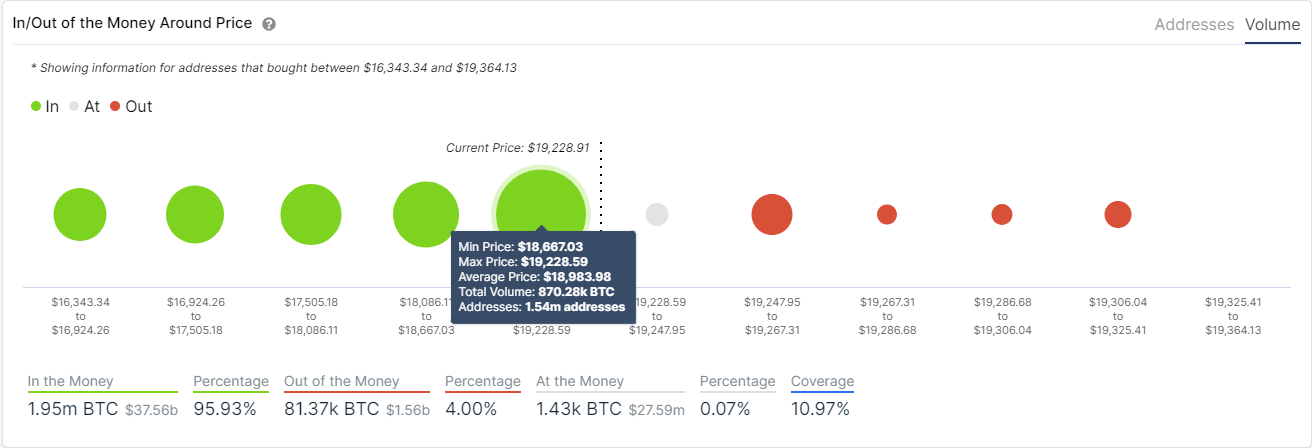
BTC IOMAP chart
However, despite the many bullish metrics in favor of Bitcoin, a bearish breakdown below the lower boundary of the pattern at $18,674 would lead Bitcoin price towards $17,600. This theory seems to coincide with the one posted by Whalemap on Twitter.
Here is what we are working with.
— whalemap (@whale_map) December 7, 2020
$18,979 is a big level. If it doesnt hold, $17,651 is our next support with possible wicks down to $17,170.
You can view the bubbles for yourself at https://t.co/i190UjTGCE pic.twitter.com/60IA4IWHLu
Whalemap is a Twitter account that focuses on on-chain metrics and notes that $18,979 is a big level in the short-term. The next support point would be located at $17,651, which coincides with the price target in case of a breakdown of the descending triangle pattern.
Author

Lorenzo Stroe
Independent Analyst
Lorenzo is an experienced Technical Analyst and Content Writer who has been working in the cryptocurrency industry since 2012. He also has a passion for trading.


