Bitcoin price $50,000 milestone short-lived as US CPI inflation signals persistent inflationary pressure
- Bitcoin price shocked the market on Monday, hitting the $50,000 milestone after two long years.
- BTC could drop 5% into the supply zone turned bullish breaker or confirm an extended fall below $45,554.
- A higher-high above the $50,368 range high would invalidate the bearish thesis, bringing $60,000 into focus.
- US CPI inflation in January printed at 3.1% on a yearly basis, above the 2.9% market expectation.

Bitcoin (BTC) price has repelled the $50,000 milestone after the Monday headline. The retraction comes following the the US CPI inflation data, which signaled persistent inflationary pressures.
Also Read: Bitcoin price hits $50,000 as Wall Street buys BTC en masse
US CPI shows inflation remains stubbornly high
US Consumer Price Index (CPI) numbers for January arrived on Tuesday morning. Per the reading, headline inflation came in hot at 3.1% in January on a yearly basis, higher than consensus expectations of 2.9%. It comes after December’s 3.4% reading.
BREAKING
— FXStreet News (@FXStreetNews) February 13, 2024
US #CPI inflation softens to 3.1% in January vs. 2.9% expected https://t.co/QzmC2tpLxZ pic.twitter.com/7ecMHJkQis
Despite the dip between December and January, the uptick from expectations signals persistent inflationary pressure as all inflation figures, whether monthly, core, annual or headline, were higher than the consensus. Amid stubborn inflation, risk-off sentiment for the markets prevails, causing the risk-on alternatives such as equities and BTC to fall.
This bout of stubborn inflation means that the Fed is unlikely to cut interest rates in the near term.
Read US CPI inflation declines to 3.1% in January vs. 2.9% forecast
Bitcoin price repels $50,000 amid US CPI inflation woes
After a landmark $50,000 retest, Bitcoin price has taken to a load-shedding exercise with technical indicators suggesting an extended fall. A 5% conservative target would reach the supply zone (turned bullish breaker) between $44,300 and $46,760. A break and close below the midline of this order block at $45,554 would confirm the continuation of the fall. This could see BTC test the $41,880 support.
Multiple technical indicators suggested an extended fall for Bitcoin price, starting with the Relative Strength Index (RSI) almost crossing below the 70 level to show BTC is ripe for selling after being overbought.
The price has also broken above the upper band of the Bollinger indicator, reinforcing the overbought supposition, meaning a pullback is likely due.
More importantly, Bitcoin price’s current Spent Output Profit Ratio (SOPR) indicates a possible correction. This is because it has increased above 1 as a 30-day moving average (MA). For the layperson, this ratio suggests that BTC holders who are sitting on unrealized profits at current Bitcoin prices may soon cash in on their gains.
These features suggest a possible correction at this point. In this respect, investors should not succumb to the fear of missing out (FOMO) and should consider waiting for the SOPR rate to fall below 1 before they can enter the market.
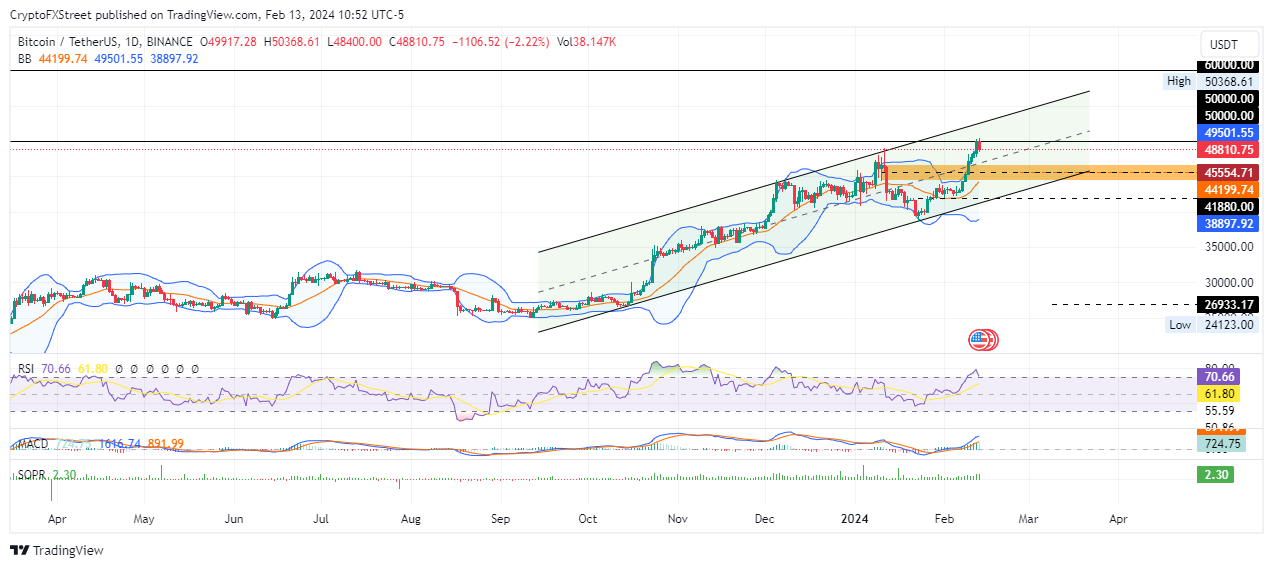
BTC/USDT 1-day chart
On the flip side, if buying pressure increases, Bitcoin price could reclaim the $50,000 landmark, or higher to clear the $50,368 range high. A decisive candlestick close above this level would invalidate the bearish thesis. In a highly bullish case, BTC could extend a neck higher to the $60,000 psychological level, nearly 25% above current levels.
Bitcoin, altcoins, stablecoins FAQs
What is Bitcoin?
Bitcoin is the largest cryptocurrency by market capitalization, a virtual currency designed to serve as money. This form of payment cannot be controlled by any one person, group, or entity, which eliminates the need for third-party participation during financial transactions.
What are altcoins?
Altcoins are any cryptocurrency apart from Bitcoin, but some also regard Ethereum as a non-altcoin because it is from these two cryptocurrencies that forking happens. If this is true, then Litecoin is the first altcoin, forked from the Bitcoin protocol and, therefore, an “improved” version of it.
What are stablecoins?
Stablecoins are cryptocurrencies designed to have a stable price, with their value backed by a reserve of the asset it represents. To achieve this, the value of any one stablecoin is pegged to a commodity or financial instrument, such as the US Dollar (USD), with its supply regulated by an algorithm or demand. The main goal of stablecoins is to provide an on/off-ramp for investors willing to trade and invest in cryptocurrencies. Stablecoins also allow investors to store value since cryptocurrencies, in general, are subject to volatility.
What is Bitcoin Dominance?
Bitcoin dominance is the ratio of Bitcoin's market capitalization to the total market capitalization of all cryptocurrencies combined. It provides a clear picture of Bitcoin’s interest among investors. A high BTC dominance typically happens before and during a bull run, in which investors resort to investing in relatively stable and high market capitalization cryptocurrency like Bitcoin. A drop in BTC dominance usually means that investors are moving their capital and/or profits to altcoins in a quest for higher returns, which usually triggers an explosion of altcoin rallies.
Author

Lockridge Okoth
FXStreet
Lockridge is a believer in the transformative power of crypto and the blockchain industry.


