Bitcoin Price Prediction: Investors need to prepare for volatile breakout
- Bitcoin price has been consolidating inside a symmetrical triangle setup for a week with no discernable directional bias.
- Investors should be prepared for a breakdown of this setup followed by a sweep of the June 18 swing low at $17,593 before bulls step in.
- A daily candlestick close below $17,593, however, without a quick recovery will trigger a bearish outlook for BTC.

Bitcoin price has been devoid of volatility for the last week and has been in a tight consolidation without directional bias whatsoever. This range bound move has formed a triangle pattern which could break either way.
Going forward, investors can expect more volatility when the New York stock market opens that could potentially disrupt the ongoing consolidation.
Bitcoin price decides between sell and buy-stop liquidity
Bitcoin price has set up roughly three higher lows and two lower highs since September 19. Connecting these swing points using trend lines results in a symmetrical triangle setup. This technical formation has no directional bias but forecasts a 7% move when it eventually does breakout. This is obtained by measuring the widest part of the triangle and extrapolating it from the breakout point either higher or lower.
What is possible, judging from the price action, is that the triangle will break down first but that this move will quickly reverse as market makers sweep the sell-stops resting below the June 18 swing low at $17,593. The subsequent U-turn will then take price higher and see it move up through the triangle and eventually breakout of the topside. Interestingly, the bearish breakout target for the triangle is at $17,328, which is where the sell-stops market makers are hunting are present.
If, in this scenario, the liquidity run sweeps the said level and recovers above $17,593, it will signal that buyers are back in control and potentially announce a reversal.
The most significant level that BTC needs to overcome is the August month’s lowest point at $19,508. Once penetrated it will then also have to flip this into a support level. This development will push Bitcoin price toward the symmetrical triangle’s bullish target at $20,520, constituting a 16% run-up from the low of the bearish fake move at $17,593.
In case of a massive surge in bullish momentum, Bitcoin price could extend its rally to the 200-week Simple Moving Average (SMA) at $23,473. This level is a significant hurdle, so a local top could form here but investors should consider a bullish squeeze to the $25,200 level.
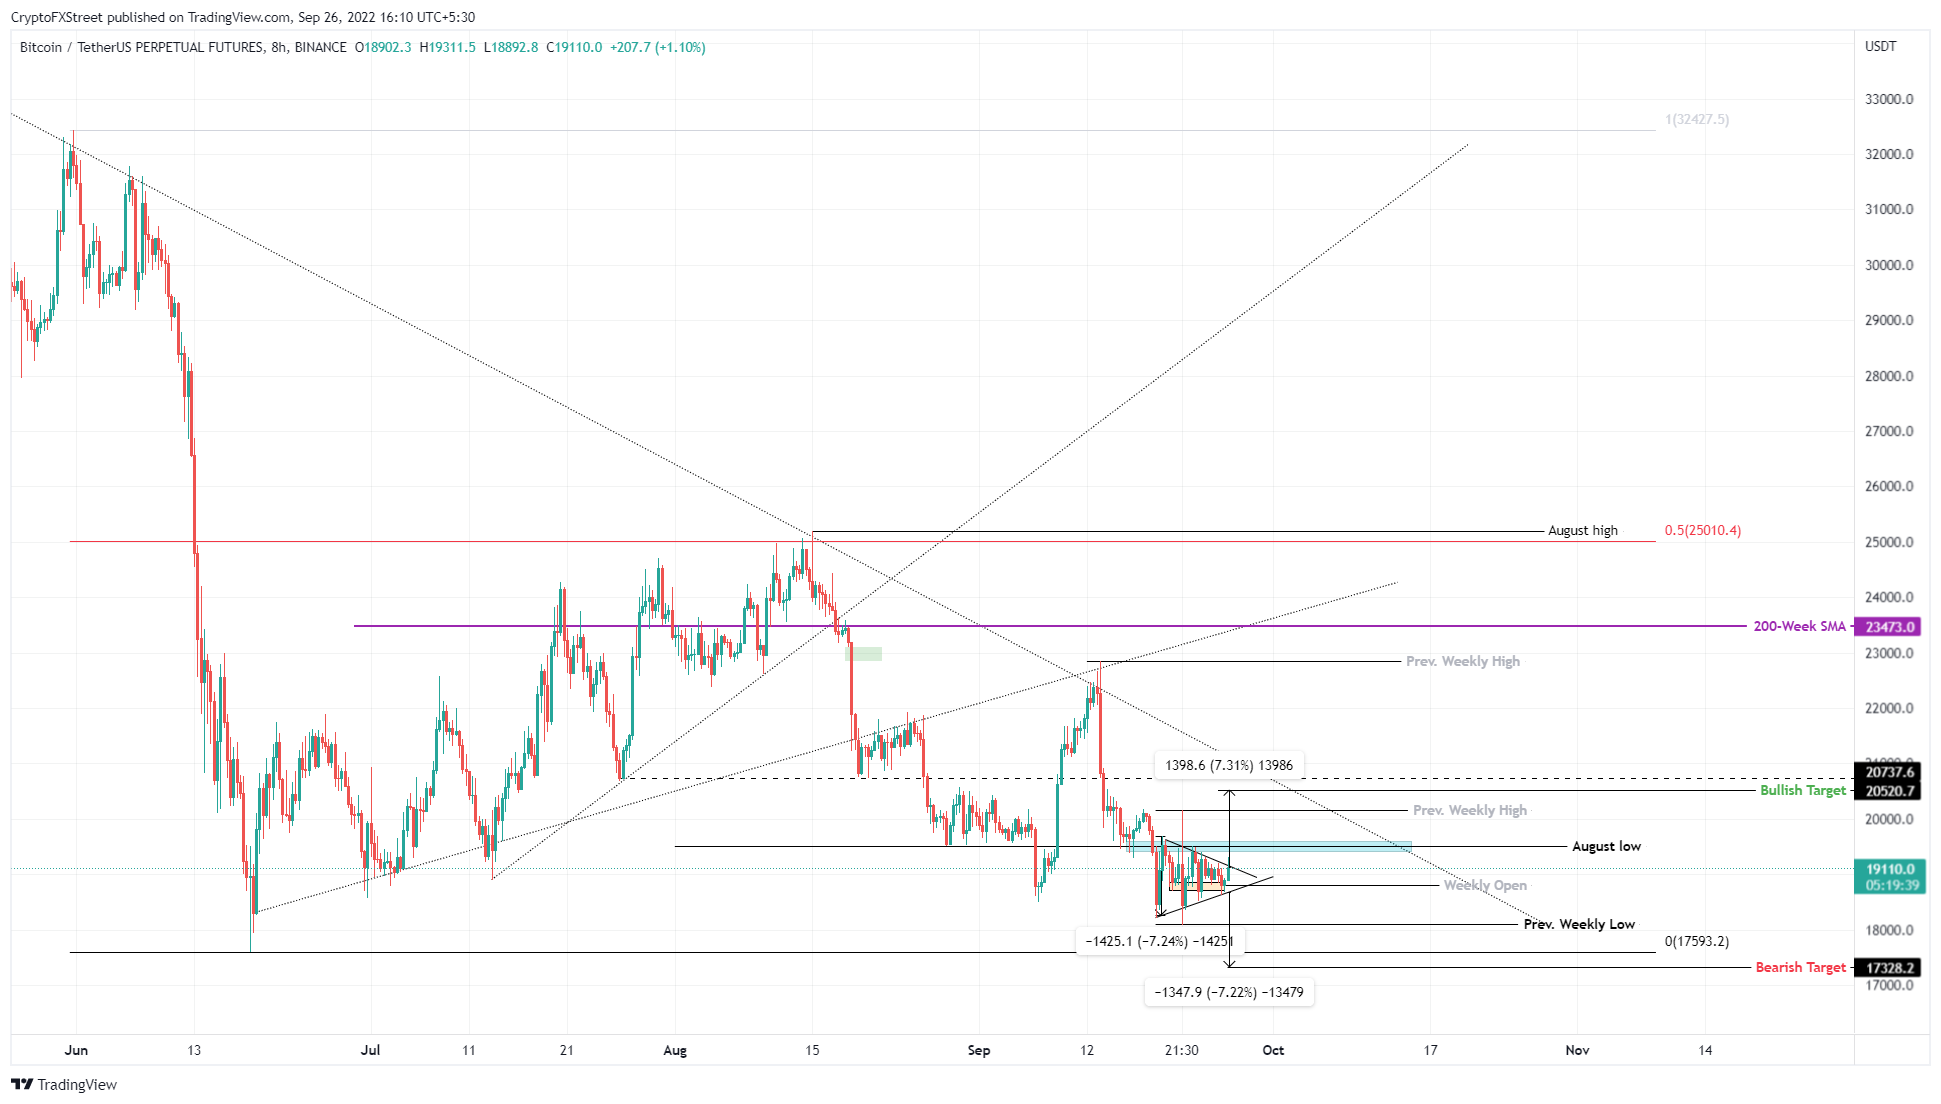
BTC/USD 8-hour chart
Although Bitcoin price does not provide clear indications of its next move, a clear breakdown and subsequent flipping of the range low at $17,593 level into a resistance level will extinguish any chances of a reversal and bullish recovery move. This could potentially see BTC then crash to the next support level at $15,550.
Author

Akash Girimath
FXStreet
Akash Girimath is a Mechanical Engineer interested in the chaos of the financial markets. Trying to make sense of this convoluted yet fascinating space, he switched his engineering job to become a crypto reporter and analyst.




