Bitcoin price prediction: BTC/USD ready for an extended correction — Bitcoin confluence
- BTC/USD retreated from the intraday high as bears got the upper hand.
- The intraday RSI implies that further correction is possible.

Bitcoin (BTC) tested area above $9,600 during early Asian hours before retreating to $9,580 by press time. The first digital asset has stayed mostly unchanged both on a day-to-day basis and since the beginning of Saturday, while some major altcoins were on the move. As a result, Bitcoin’s market dominance index dropped to 61%, while its market capitalization is registered at $176 billion. Currently, BTC/USD is moving within a short-term bearish trend, the volatility is low.
BTC/USD 1-hour chart
-637312832091696066.png)
On the intraday charts, BTC/USD is along the upside-looking the middle line of the 1-hour Bollinger Band. The price dipped to $9,570 and tested 50-hour SMA, but managed to partially regain the ground. Considering that the intraday RSI has already reversed to the downside, the price may resume the bearish correction with the next focus on $9,500 reinforced by 100-hour SMA and $9,350 (50-day SMA and 200-hour SMA).
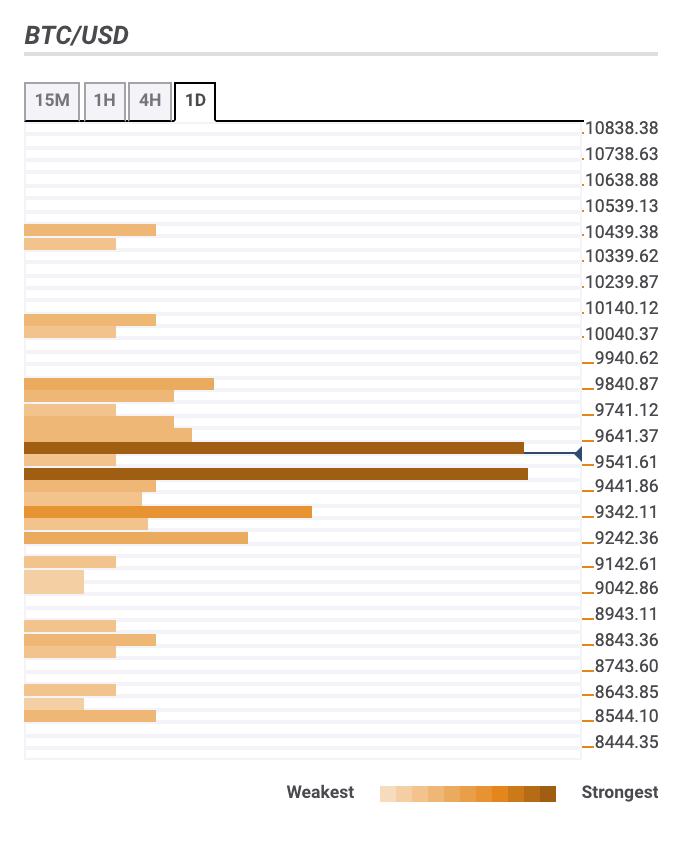
Bitcoin confluence levels
There are several important technical barriers clustered above and below the current price, which means BTC/USD may spend some time in a range, before the further direction is clarified. Let’s have a closer look at the support and resistance levels.
Resistance levels
$9,600 — the upper line of the 4-hour Bollinger Band, the middle line of the 1-hour Bollinger Band, 61.8% Fibo retracement daily, 38.2% Fibo retracement daily, 23.6% Fibo retracement weekly
$9,800 — 61.8% Fibo retracement monthly, Pivot Point 1-day Resistance 2
$10,000 — Pivot Point 1-month Resistance 1
Support levels
$9,500 — 1-hour SMA200, 38.2% Fibo retracement weekly
$9,350 — 61.8% Fibo retracement weekly, the lower line of the 4-hour Bollinger Band, 1-hour SMA200, 4-hour SMA50
$9,000 — the lower line of the daily Bollinger Band
BTC/USD, 1-day
Author

Tanya Abrosimova
Independent Analyst