Bitcoin Price Prediction: BTC/USD bounce to $10,000 in the offing – Confluence Detector
- Bitcoin price holds above $9,200, extending the consolidation from the weekend session.
- Bitcoin upside limited at $9,296 (confluence detector initial resistance).

Bitcoin has been lethargic in its trading since the recovery from the slide in the last week of June that tested support at $8,800. The previous week’s attempts to push Bitcoin above $9,500 lost traction at $9,481 with a trendline resistance standing strongly in the way. The just-concluded weekend session remained in consolidation with gains above $9,300 being unsustainable.
BTC/USD has already retreated to $9,272 (prevailing market value). The technical picture printed by indicators such as RSI and MACD is drab and mainly supporting sideways trading. The RSI is moving sidelong at 54 in turn highlighting the possibility of consolidation lasting longer in the course of the new week.
The MACD also reflects the same sideways trading action as the RSI. For some time now, the indicator has been clinging to the midline. Both the RSI present opportunities for traders to watch out on the direction Bitcoin price is likely to take in the coming sessions.
Generally, the ongoing consolidation could last longer as described above. Support is anticipated at $9,200, $9,000 and $8,800 as well as at the moving averages (the 50 SMA at $9,247.37 and the 100 SMA at $9,184.65 in the 4-hour range).
Related content: Tezos Price Forecast: XTZ/USD majestically rises to take down $3.00 resistance
BTC/USD 4-hour chart
-637302114874251508.png)
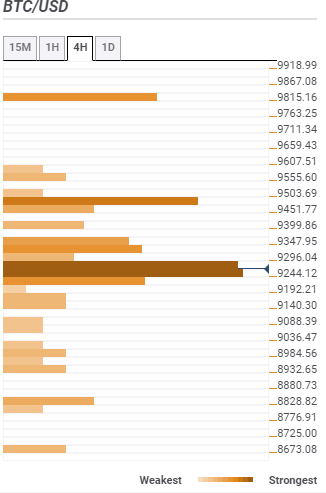
Bitcoin confluence resistance and support areas
Resistance one: $9,296 – The confluence detector in the 4-hour range highlights this as the first significant resistance where the Fibonacci 38.2% one-day, the SMA five 15-minutes, the previous high 15-minutes and the Bollinger Band 15-minutes middle curve among other indicators converge.
Resistance two: $9,347 – This region is home to the previous high 4-hour, the Fibonacci 23.6% one-week and the previous high one-day.
Support one: $9,244 – The Bollinger Band one-day middle, the Fibonacci 61.8% one-day, the Bollinger Band 4-hour middle, the SMA 200 1-hour, SMA ten one-day and SMA 50 4-hour meet.
Support two: $9,140 – Is home to the Bollinger Band 4-hour lower curve, the previous low one-day and the Fibonacci 61.8% one-week.
More Bitcoin levels
Author

John Isige
FXStreet
John Isige is a seasoned cryptocurrency journalist and markets analyst committed to delivering high-quality, actionable insights tailored to traders, investors, and crypto enthusiasts. He enjoys deep dives into emerging Web3 tren


