Bitcoin Price Prediction: BTC on the verge of a major price movement
- BTC is currently trading at $11,339 after a slight pullback from the peak of $11,736.
- Several on-chain metrics are showing Bitcoin is ready for a major price movement soon.

Bitcoin had a strong performance in the past week, climbing from a low of $10,575 to a high of $11,736, mostly impulsed by the positive news from several huge companies investing in Bitcoin. Stone Ridge, a multi-billion dollar company, recently announced the purchase of $115 million worth of BTC, around 10,000 coins.
Previously, Square, a company co-founded by Jack Dorsey, the CEO of Twitter, also announced they invested $50 million into Bitcoin, making the digital asset jump 2.5% within the next few hours, eventually breaking above $11,000 for the first time in a couple of weeks.
Numerous metrics are showing a significant price move is underway
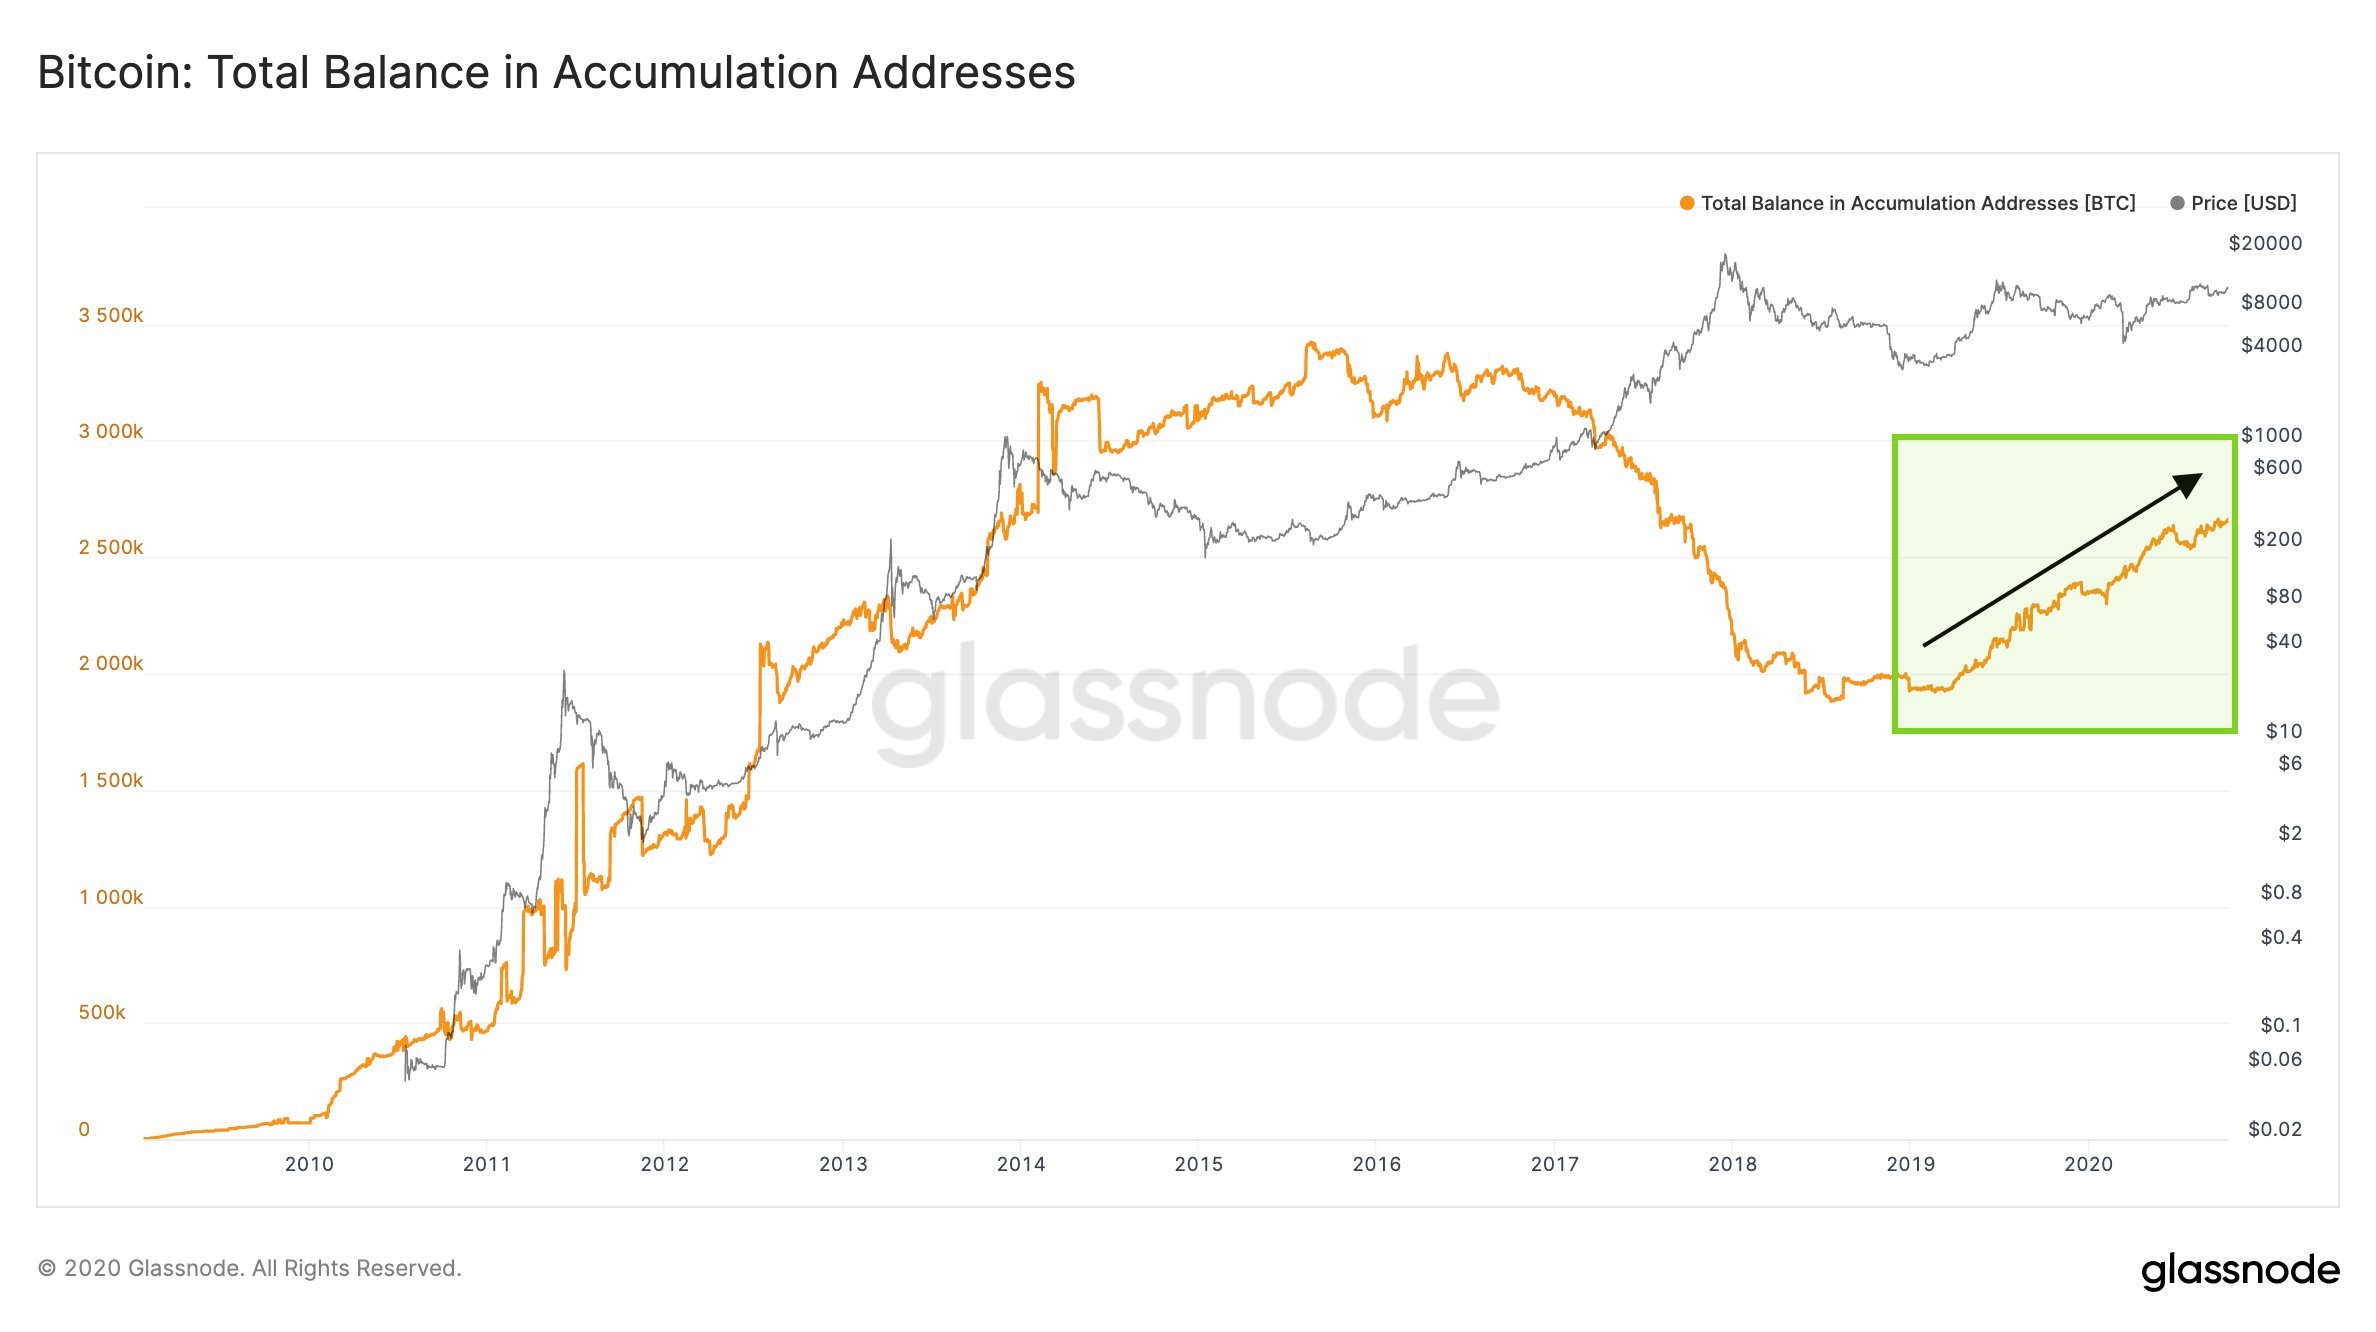
Recent statistics released by Glassnode show that the interest in holding Bitcoin has been growing significantly over the past two years. The number of accumulation addresses, defined as ‘addresses that have at least two incoming transactions and have never spent BTC’, has increased significantly. This number was trending down since 2016.
BTC Accumulation Addresses Chart
Looking at the daily chart, we can observe that Bitcoin is now trading inside an uptrend after establishing several higher lows and higher highs. The MACD has been bullish since September 15, and it’s still gaining positive momentum.
BTC/USD daily chart
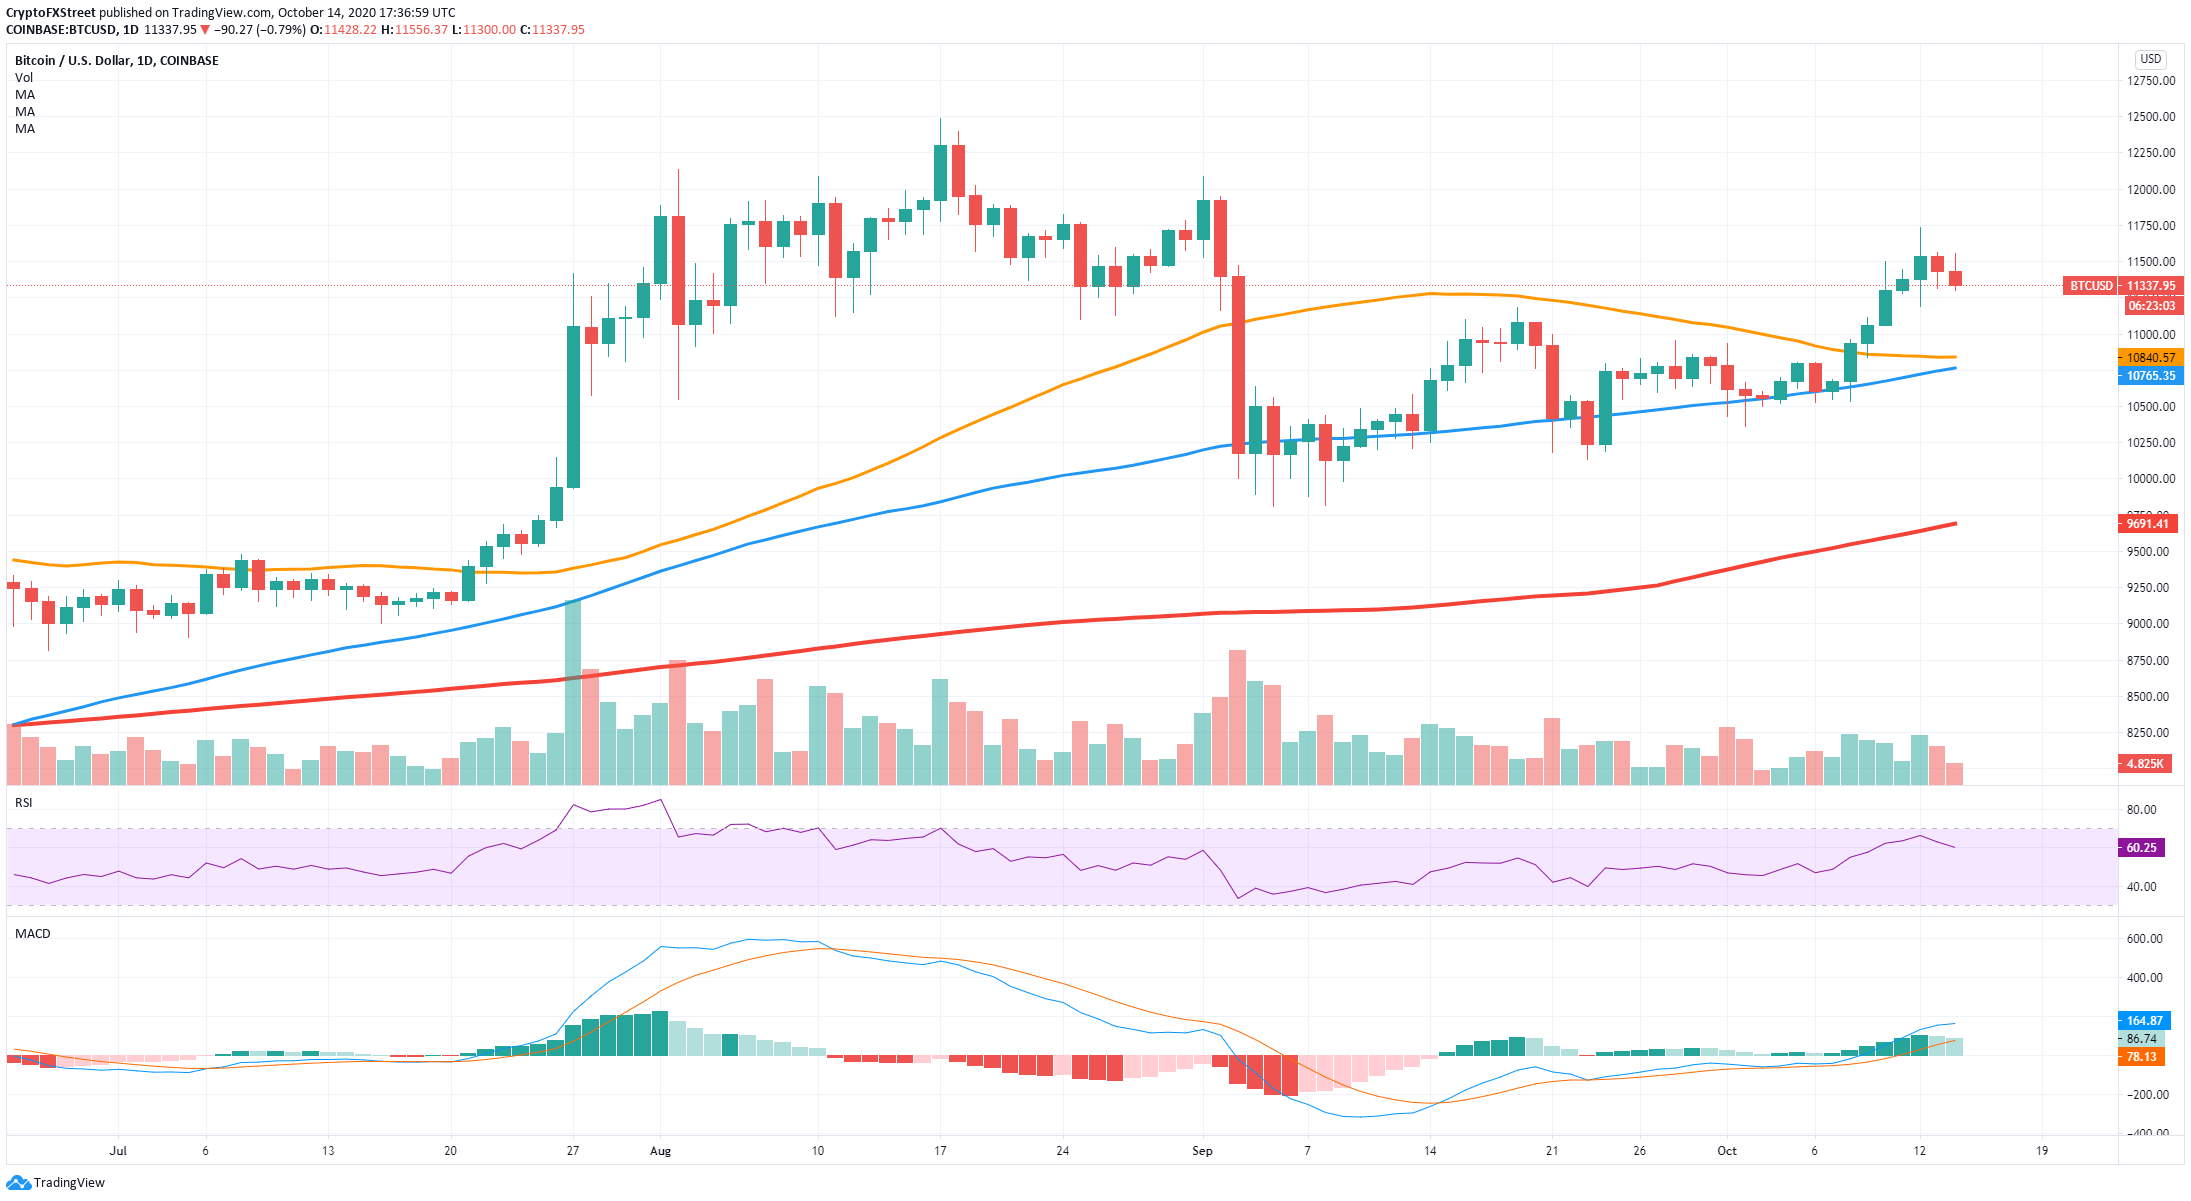
More importantly, the 100-SMA and the 50-SMA were both turned into support levels and defended several times on the way up. The RSI was close to being overbought but has cooled off quite a bit, thanks to the most recent 3% pullback.
BTC IOMAP Chart
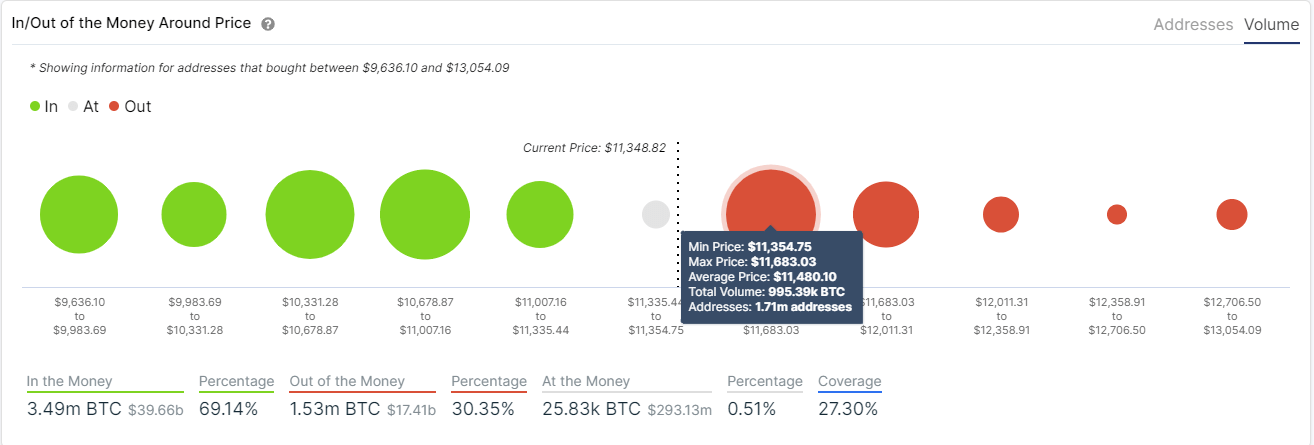
The In/Out of the Money Around Price chart shows a strong resistance area between $11,354 and $11,683 with almost 1 million in BTC volume; however, there are almost no hurdles above this point well into $13,000. A breakout above $11,683 could most certainly push Bitcoin at least towards $12,000 in the short-term.
BTC Volatility Chart
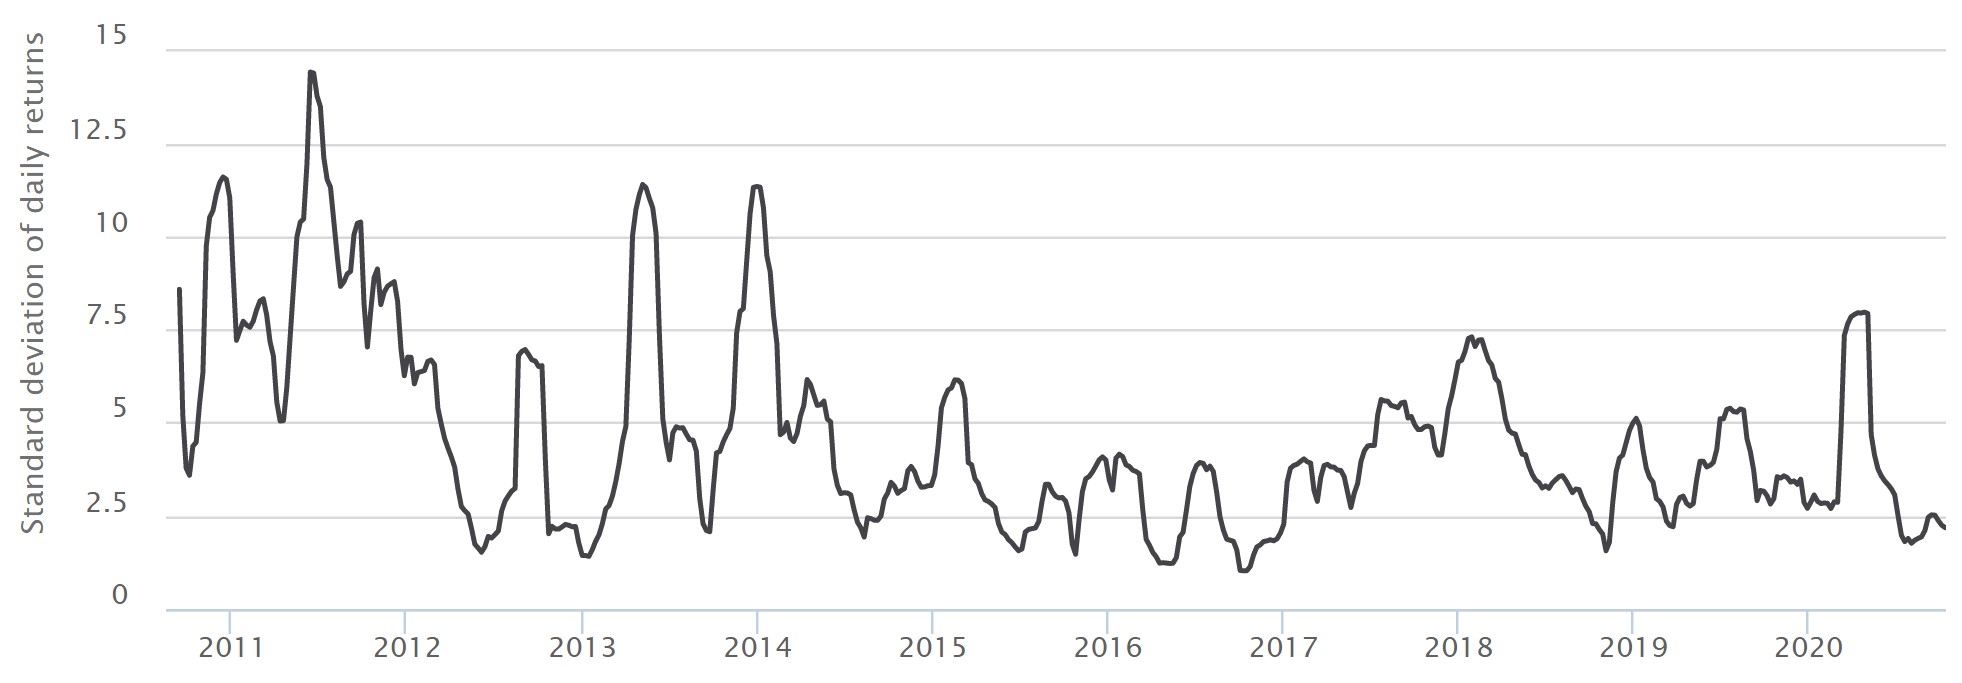
Another metric that supports the theory that Bitcoin is close to a major price move is the volatility. In the past few months, the volatility of the flagship cryptocurrency has declined significantly and is sitting near historic lows. When the number is so low, it’s usually an accurate indicator of major upcoming price moves.
Bearish signs for Bitcoin
Nonetheless, the bears are not out of the game just yet, especially after the last 3% pullback from the top at $11,736. Let’s explore several on-chain metrics in favor of the bears and any significant chart patterns and indicators on various time-frames.
BTC/USD daily chart
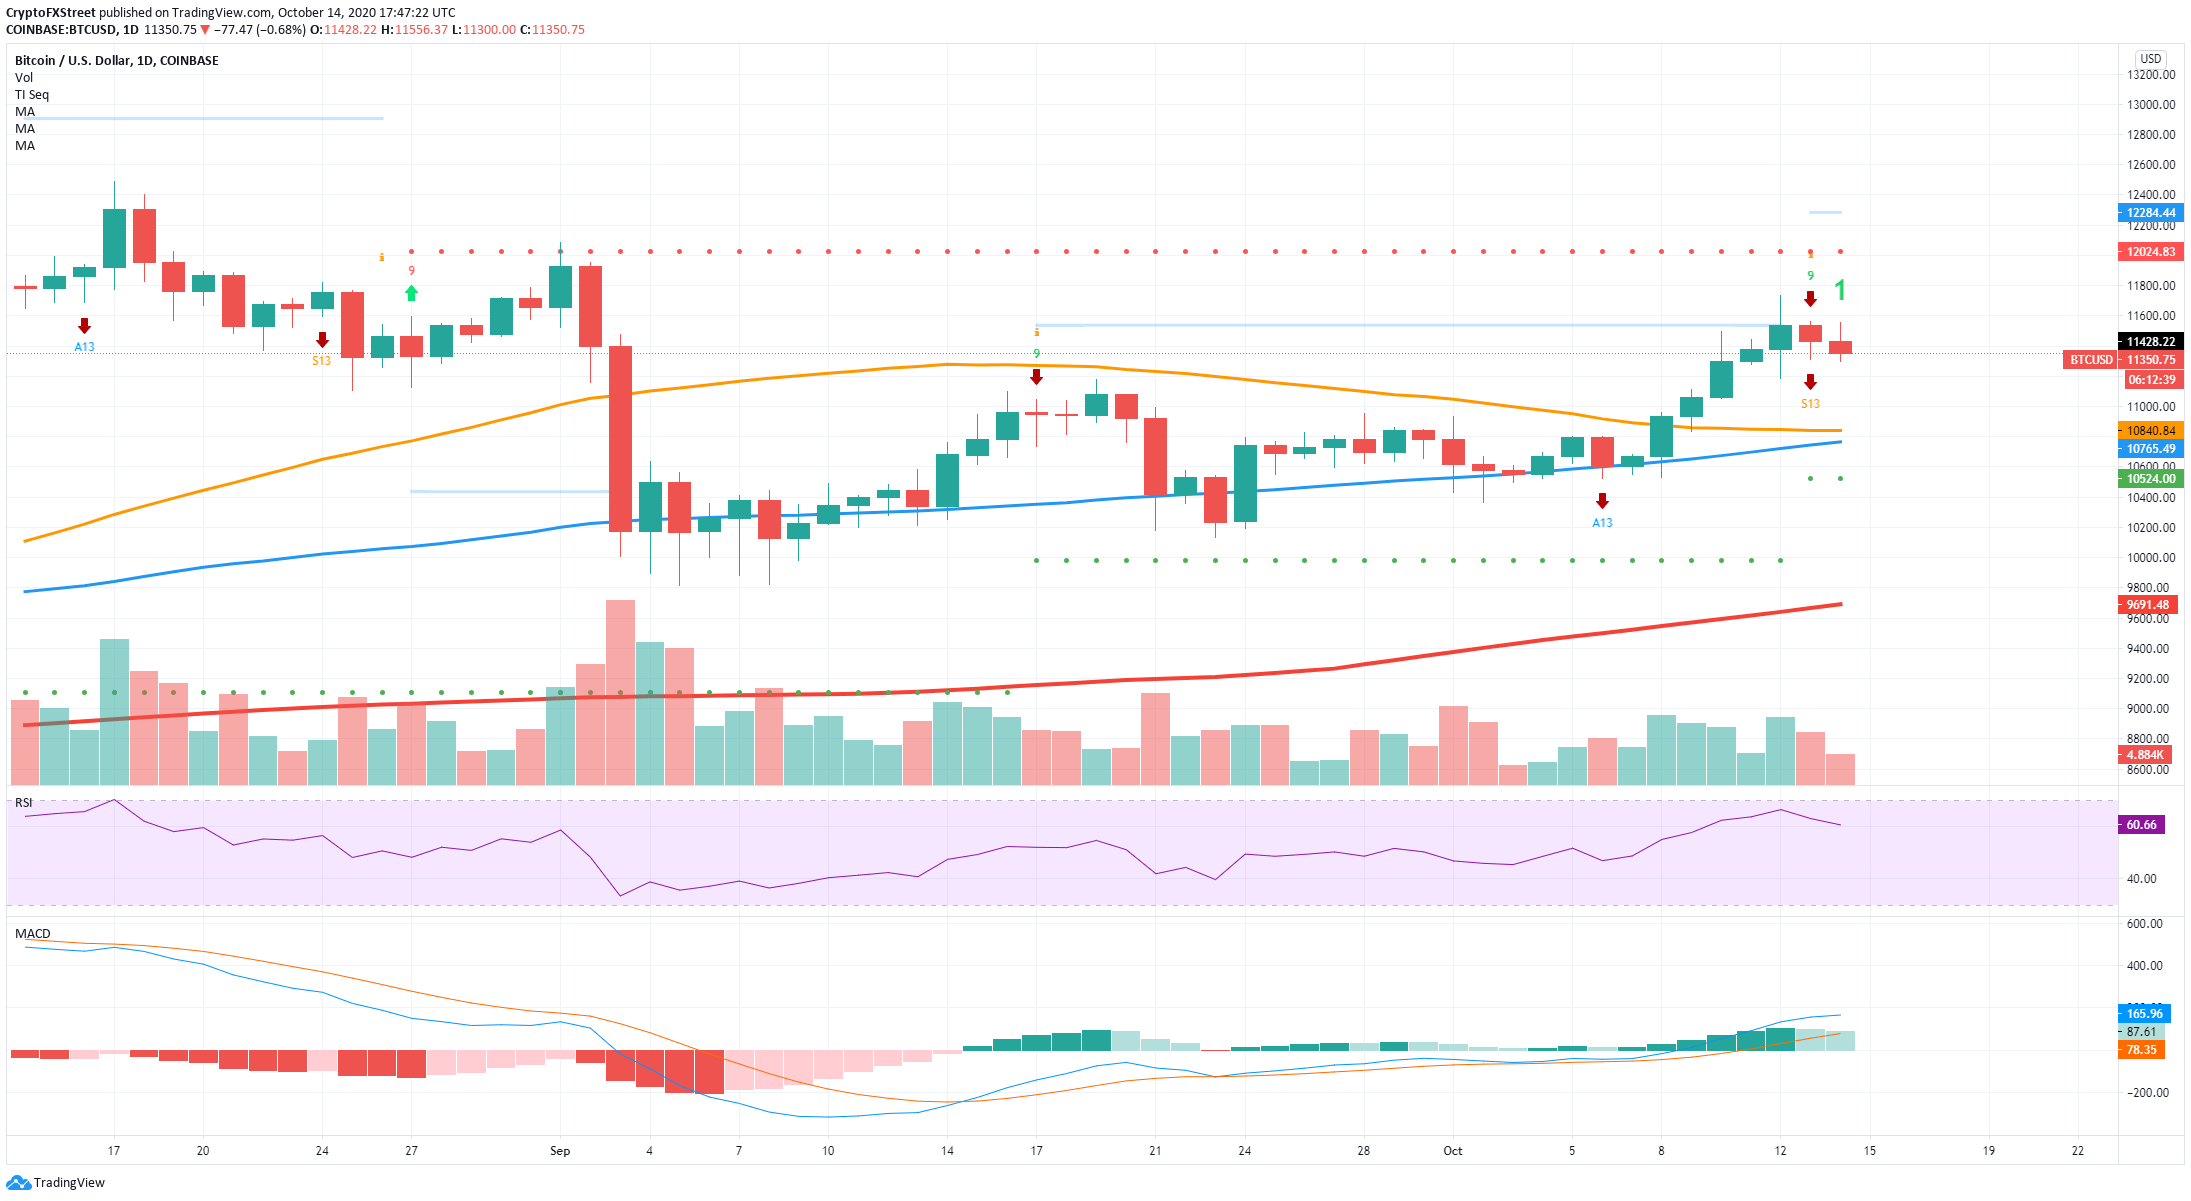
The most notable signal on the daily chart is the one presented by the TD sequential indicator. On October 13, the indicator posted a sell signal that seems to have been confirmed with the red candlestick we see today. Bitcoin could be eying up a re-test of the psychological support level at $11,000.
BTC Holders Distribution Chart
 [19.47.53, 14 Oct, 2020]-637382950149502511.png)
Another concerning trend for Bitcoin bulls is the number of whales exiting. Looking at the Holders Distribution chart provided by Santiment, we can notice the number of investors holding between 10,000 and 100,000 coins has been decreasing since October 6 from a high of 111 to only 107 currently.
BTC/USD 1-hour chart
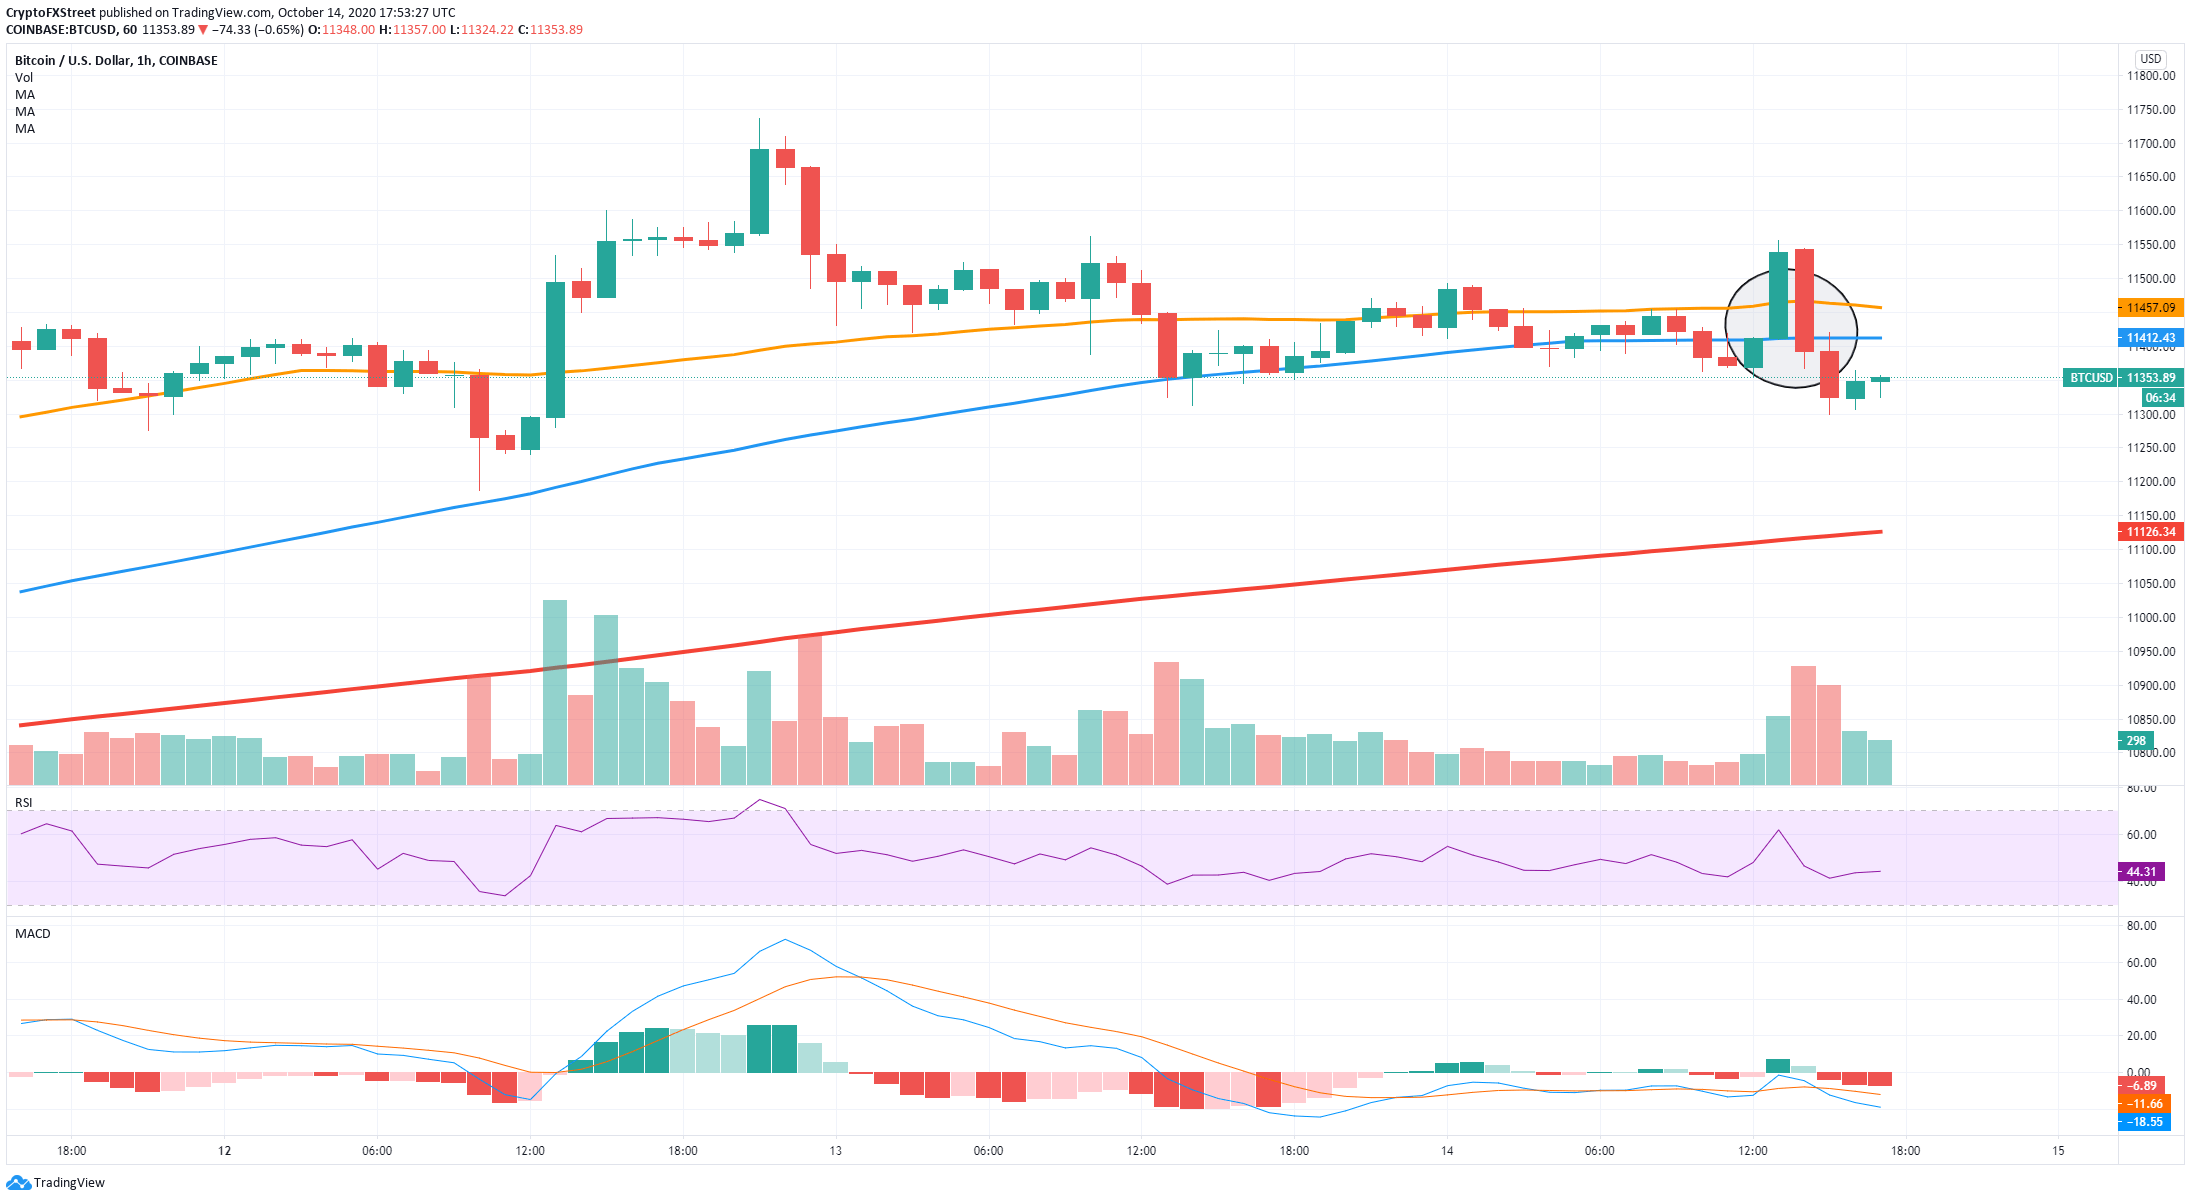
On the 1-hour chart, the bears took control already, pushing BTC's price below the 100-SMA and the 50-SMA, turning both into resistance levels. Additionally, they were able to establish lower lows and lower highs, confirming a downtrend.
Key price points to keep in mind
Investors looking for a bullish entry have to pay close attention to the only significant resistance area between $11,354 and $11,683. A breakout above this area can lead Bitcoin towards $12,000 and eventually even to $13,000 as there is very little resistance to the upside.
On the other hand, bears seem to have taken control in the short-term. The TD indicator presented a sell signal on the daily chart. Bearish continuation could push the flagship cryptocurrency towards the psychological level of $11,000.
Author

Lorenzo Stroe
Independent Analyst
Lorenzo is an experienced Technical Analyst and Content Writer who has been working in the cryptocurrency industry since 2012. He also has a passion for trading.


