Bitcoin Price Prediction: BTC flashes sell signal, short-term correction imminent
- BTC bulls have stayed in control since October 7, taking the price up from $10,600 to $11,500.
- The price has struggled to break past the $11,700 resistance line.

After falling from $11,925 to $10,165 on 2nd and 3rd September, Bitcoin entered a consolidation period, which lasted till October 7. During this period, the premier cryptocurrency managed to stay above the $10,000-mark. Finally, on October 7, BTC started a bullish rally, which saw it go up from $10,600 to $11,500 (as of writing).
The technical outlook
Despite this strong upward movement, the price has currently faced rejection at the $11,700 resistance level. While the MACD shows sustained bullish momentum, it looks like this level has been strong enough to absorb an immense amount of buying pressure.
BTC/USD daily chart
-637381531050372689.png)
The TD Sequential Indicator has also flashed the sell signal this Tuesday, which could trigger a downward price movement. IntoTheBlock’s “In/Out of the Money Around Price” or IOMAP suggests that a healthy support level lies at $11,350. As per the model, 1.5 million addresses had previously purchased 730,000 BTC at this level.
BTC IOMAP
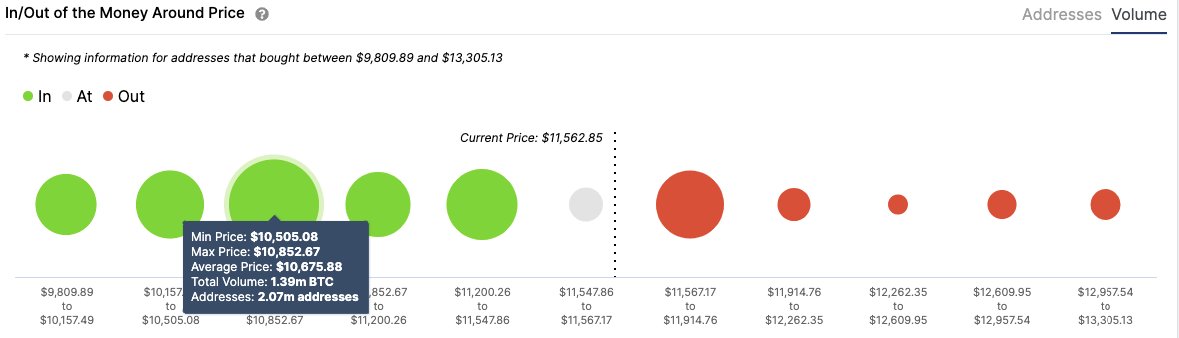
If the price break below this level, then the next strong support zone lies between $10,500 and $10,850. The zone is particularly strong since it includes the 50-day SMA and 100-day SMA, as well. Previously, at this level, 2 million addresses had purchased 1.4 million BTC. This zone should be strong enough to absorb any selling pressure, effectively capping BTC’s downside at this level.
The Flipside: How can the bulls continue to stay in control?
The buyers can shrug off the effects of the TD indicator and continue its upward trend by conquering the $11,700 resistance line. Despite the recent price rejection, the IOMAP clearly shows us that going past this level will give the bulls enough firepower to reach the $13,000-level. The bulls will also be encouraged by the whales' actions, which shows that they have been strengthening their positions, instead of dumping their coins.
BTC holders distribution
 [07.40.12, 13 Oct, 2020]-637381531736518976.png)
According to Santiment’s holders distribution chart, the number of addresses holding 1,000-10,000 BTC increased from 2,075-2,080 from 11th October to 12th October. Similarly, the number of addresses having 10,000 BTC -100,000 BTC went up from 108 to 109 in the same time period. This is a positive sign for BTC as it shows an increasing amount of addresses holding a significant chunk of the premier cryptocurrency.
Key price level to watch
If the price begins its downward swing and manages to break below the $11,350 support line, all eyes will be on the support zone between $10,500 and $10,850. While this level looks strong enough to absorb any selling pressure, any break below it will be catastrophic as it will drop BTC to the 200-day SMA ($9,650).
On the flip side, the bulls can turn this narrative around by simply conquering the $11,700 resistance line. By breaking above this level, the bulls will have a clear path to $13,000.
Author

Rajarshi Mitra
Independent Analyst
Rajarshi entered the blockchain space in 2016. He is a blockchain researcher who has worked for Blockgeeks and has done research work for several ICOs. He gets regularly invited to give talks on the blockchain technology and cryptocurrencies.




