Bitcoin Price Prediction: BTC aiming for $12,000 as whales are not dumping just yet
- BTC is currently trading at $11,560 after a significant breakout above the critical resistance level at $11,000.
- The flagship cryptocurrency is not facing a lot of selling pressure, according to on-chain metrics.

Bitcoin is leading again and has increased its dominance over the market from a low of 56% on September 13 to 58.4% currently. The market capitalization of BTC also grew tremendously over the past week, gaining around $20 billion for a total of $213 billion in mcap.
Bitcoin whales are not dumping
According to a report by CryptoQuant, a data platform for professional crypto traders, the exchange inflow of BTC is not above the danger zone. The chart below showed an example when many Bitcoins were sent to exchanges, right before the massive crash of March 12. The current number of coins going to exchanges is far lower, indicating that whales are not looking to sell just yet.
$BTC dumping is not going to happen.
— Ki Young Ju 주기영 (@ki_young_ju) October 12, 2020
All Exchanges Inflow Mean usually indicates how many whales are active on exchanges. Above 2 BTC is the danger zone, and we're still in the safe zone.
Join our Telegram channel to get sophisticated whale signals.https://t.co/gnUU2QURa5 pic.twitter.com/gSQgMRAzeH
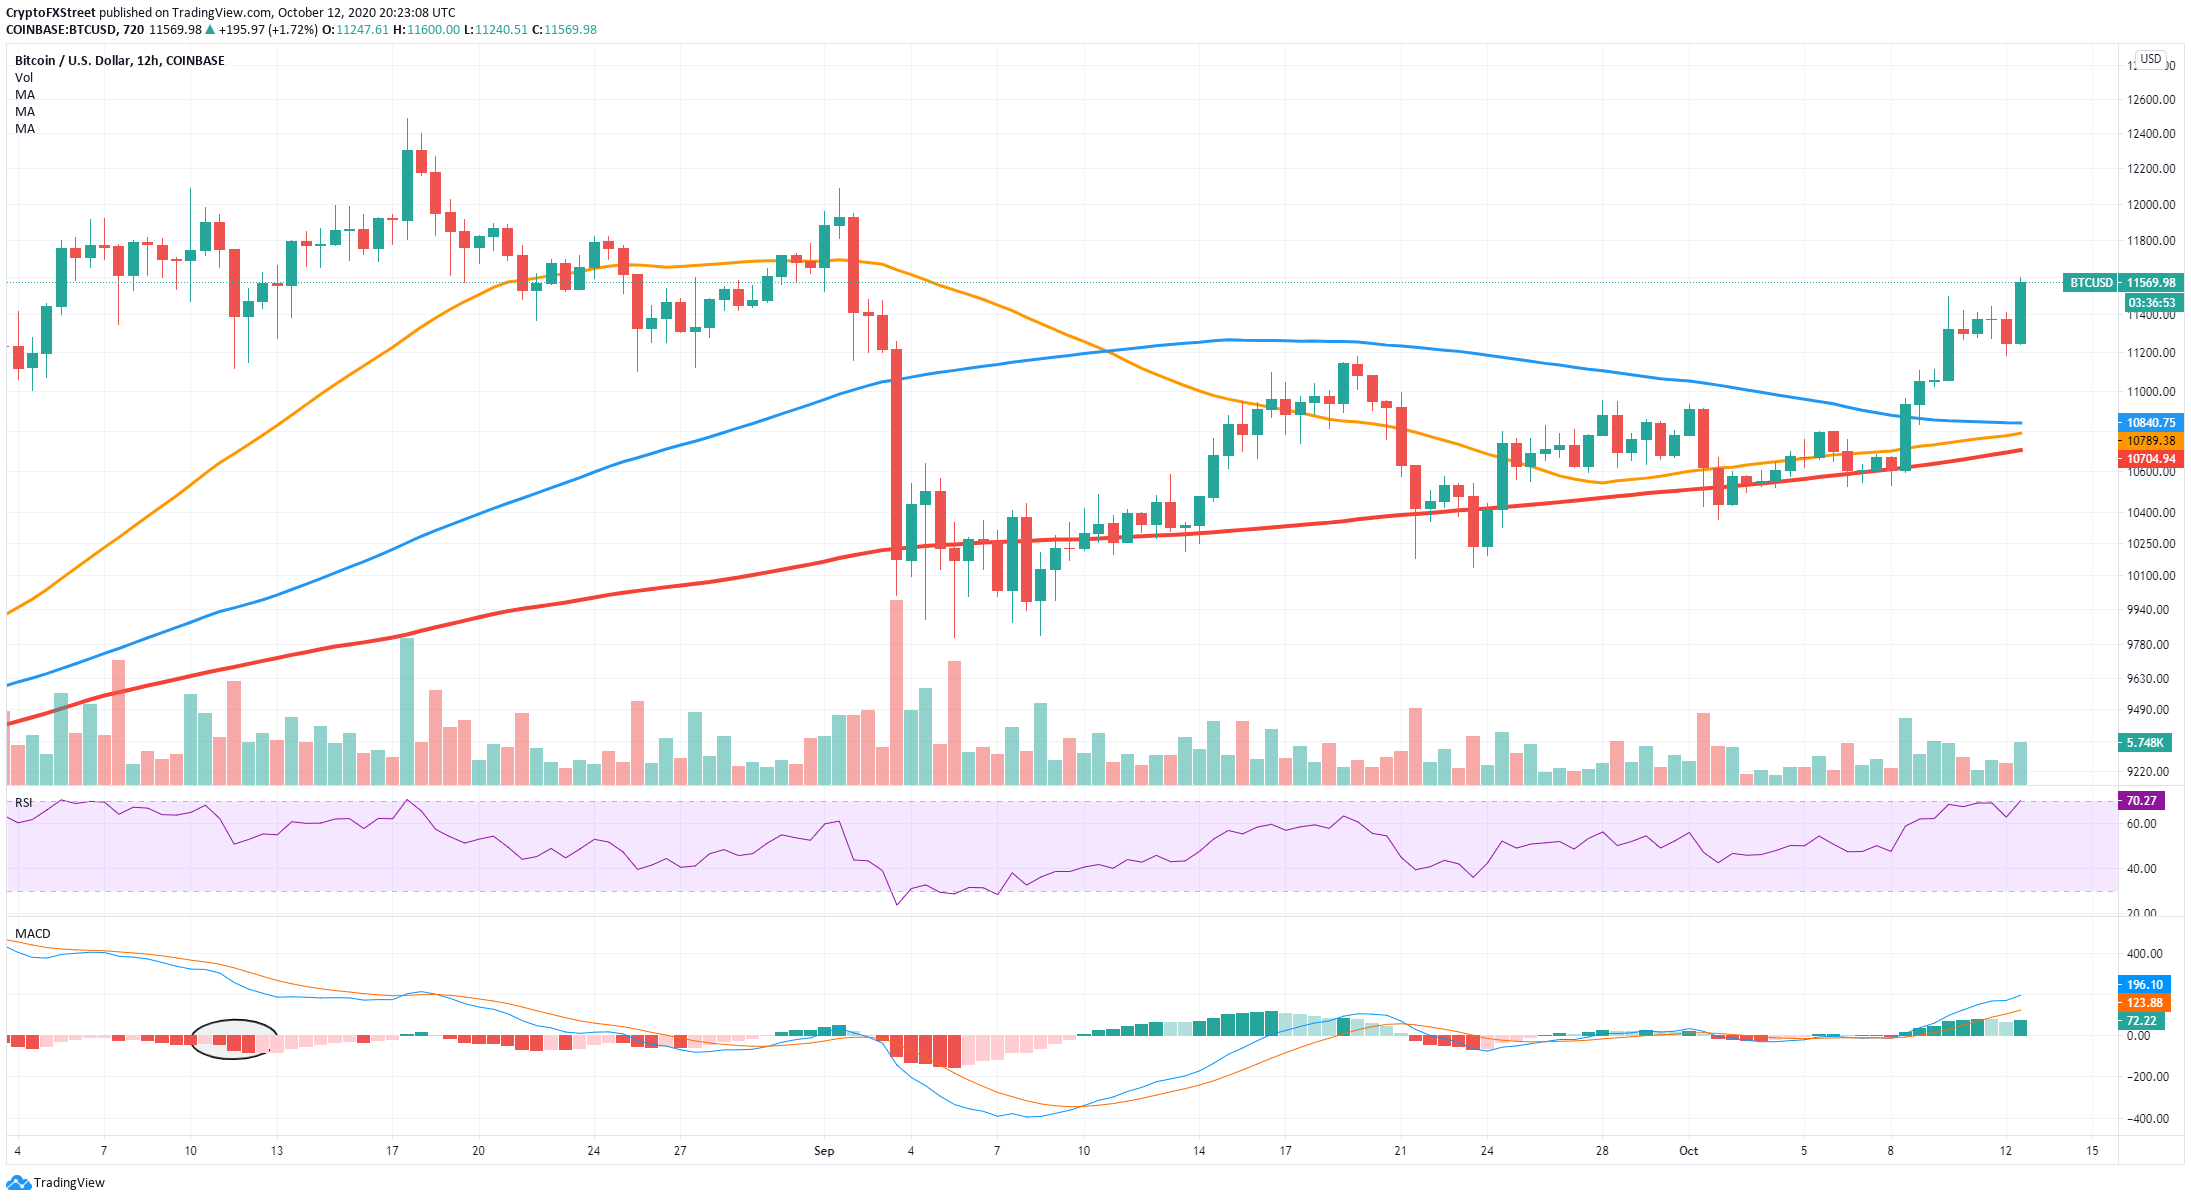
On the 12-hour chart, the digital asset has managed to climb above the 50-SMA, the 100-SMA, and the 200-SMA, turning all three into support levels. From a technical standpoint, the next resistance level is all the way up at $12,000, a crucial psychological level.
BTC/USD 12-hour chart
The In/Out of the Money Around Price chart by IntoTheBlock shows that BTC has a lot more support than resistance. The only notable resistance area is between $11,586 and $11,934, with a volume of 654,000 BTC. On the other hand, practically all support areas below $11,567 have the same volume or more. Above $11,934, there is almost no resistance.
BTC IOMAP Chart

Bitcoin could be looking at a sell signal on the daily chart
The TD sequential indicator is on the verge of presenting a sell signal on the daily chart. The indicator just posted a green ‘8’, which usually precedes a ‘9’, a strong signal to sell. Furthermore, the RSI is also extremely close to overextension, something that hasn’t happened since July 26, and usually indicates that a pullback is nearby.
BTC/USD daily chart
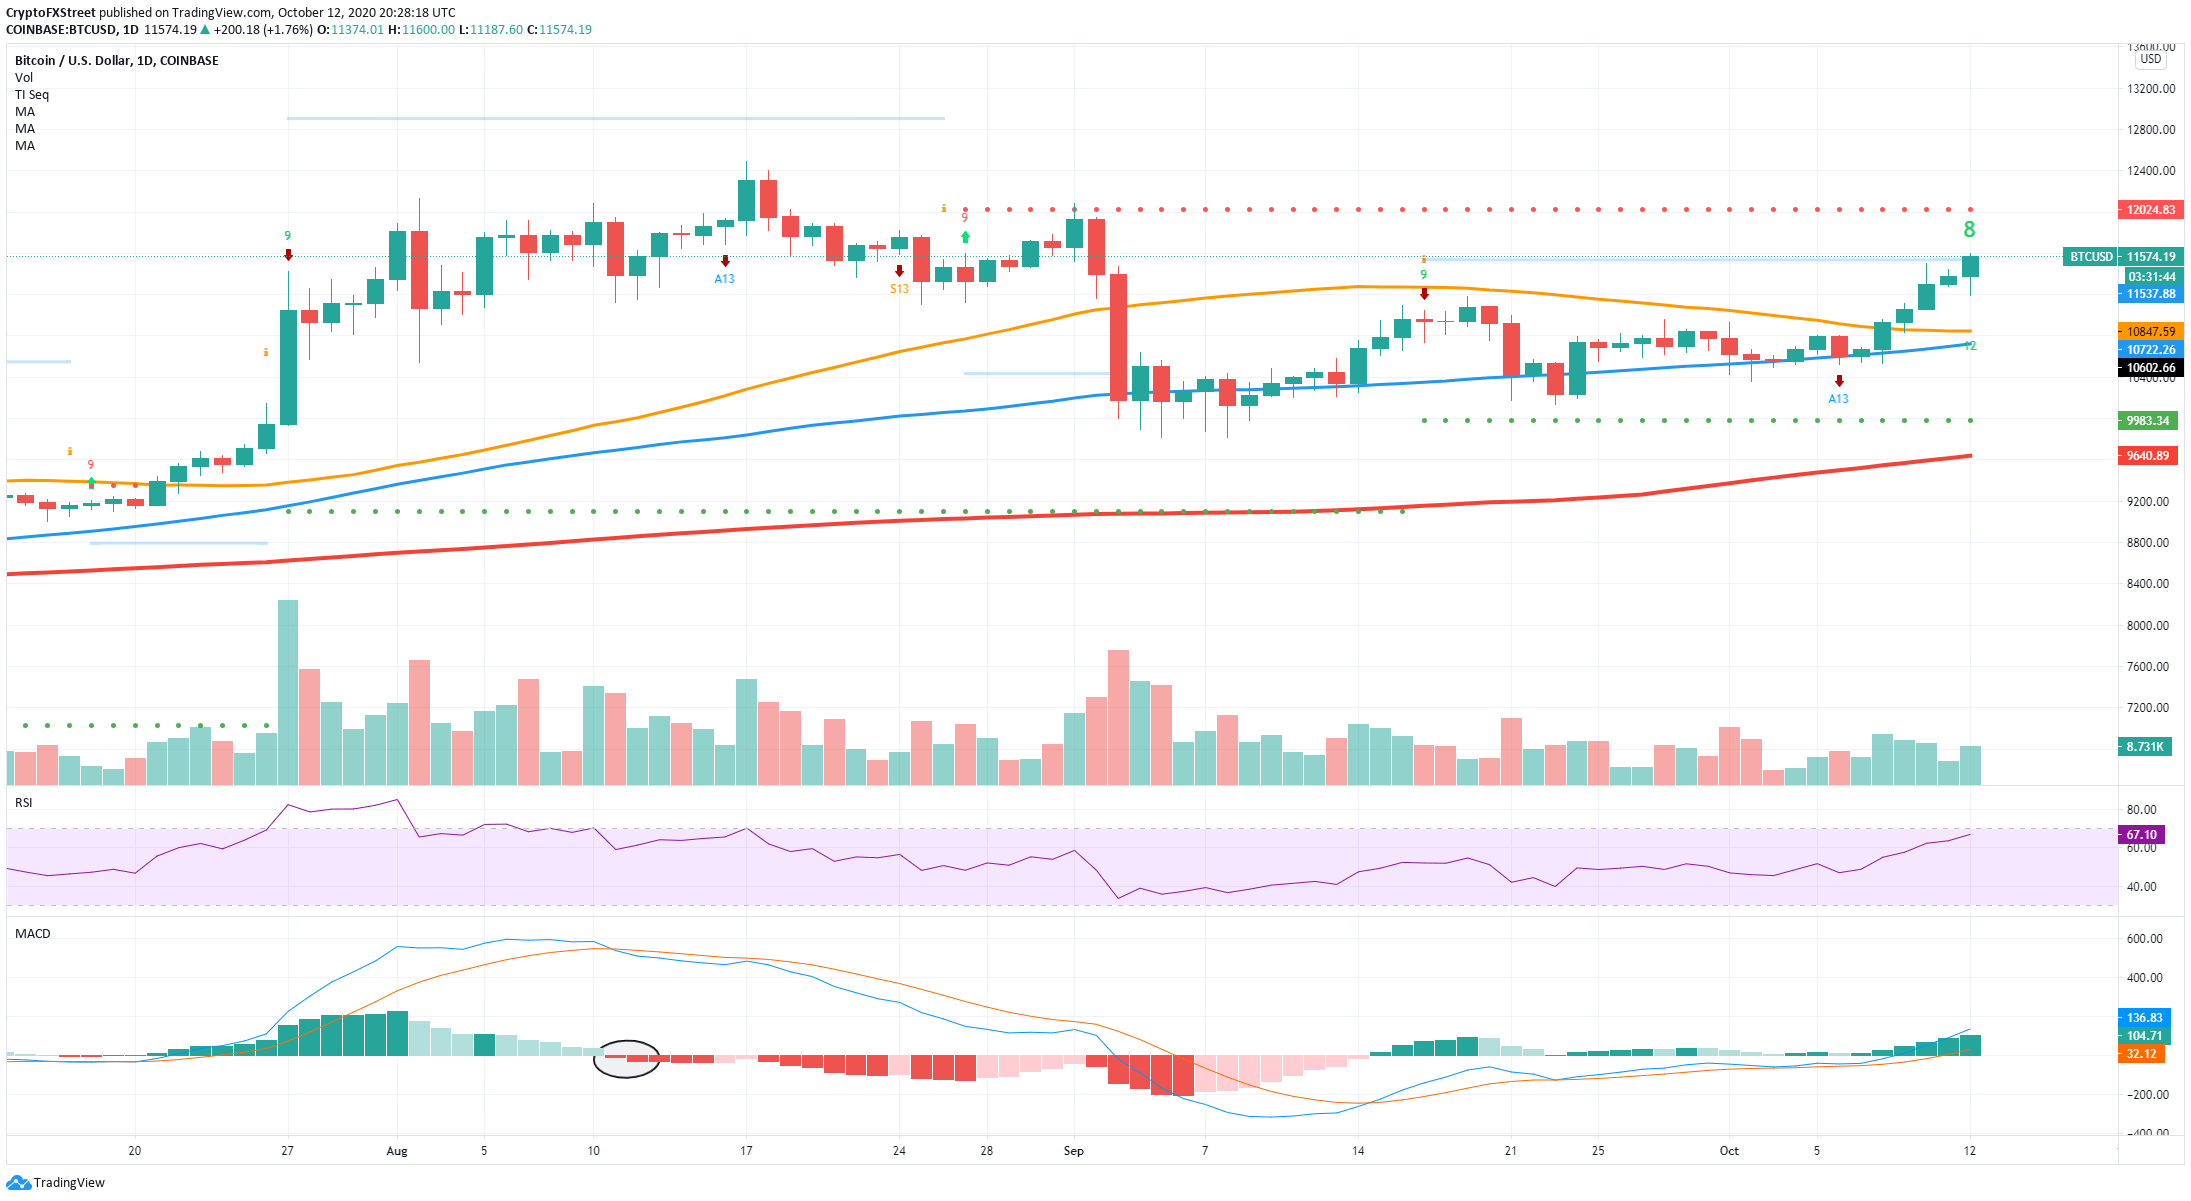
The confirmation of the sell signal can push the flagship cryptocurrency towards $11,000 to re-test the psychological level. A further breakout below this point would drop BTC to the 50-SMA at $10,847 and potentially the 100-SMA at $10,722.
Important levels for Bitcoin
It seems that despite Bitcoin’s price rising fast, the inflow volume of the coin is not going up, which means whales are not willing to sell just yet. BTC aims to hit $12,000 in the short-term, but a breakout above this level would most likely take it to a new 2020-high as there is almost no resistance beyond that point.
On the other hand, the TD sequential indicator is close to presenting a sell signal on the daily chart. The last signal made BTC lose 9% of its value over the next week. Validation of the TD signal can take the digital asset down to $11,000 and potentially $10,847 to $10,722.
Author

Lorenzo Stroe
Independent Analyst
Lorenzo is an experienced Technical Analyst and Content Writer who has been working in the cryptocurrency industry since 2012. He also has a passion for trading.


