Bitcoin price near record high, but deep correction awaits eager speculators
- Bitcoin price again above the February high of $58,367.
- Coibase’s direct listing anticipated to be supportive of Bitcoin.
- IOMAP data shows abundant support below the current price.

Outside of the March blip, Bitcoin price has failed to convincingly get above the February high at $58,367, creating a mix of anticipation and restlessness among speculators and media titans. The last three days’ price action has voided the head-and-shoulders top alternative and puts the attention back again on the rising wedge thesis.
Bitcoin price consolidation falsely maintaining proponents high expectations
The IntoTheBlock In/Out of the Money Around Price (IOMAP) data shows virtually no resistance between $60,026 and $60,327. On the other hand, the data reveals notable support between $56,406 and $59,965, with 3.9 million addresses buying 1,370.60k BTC. A range that includes the lower trend line of the rising wedge.
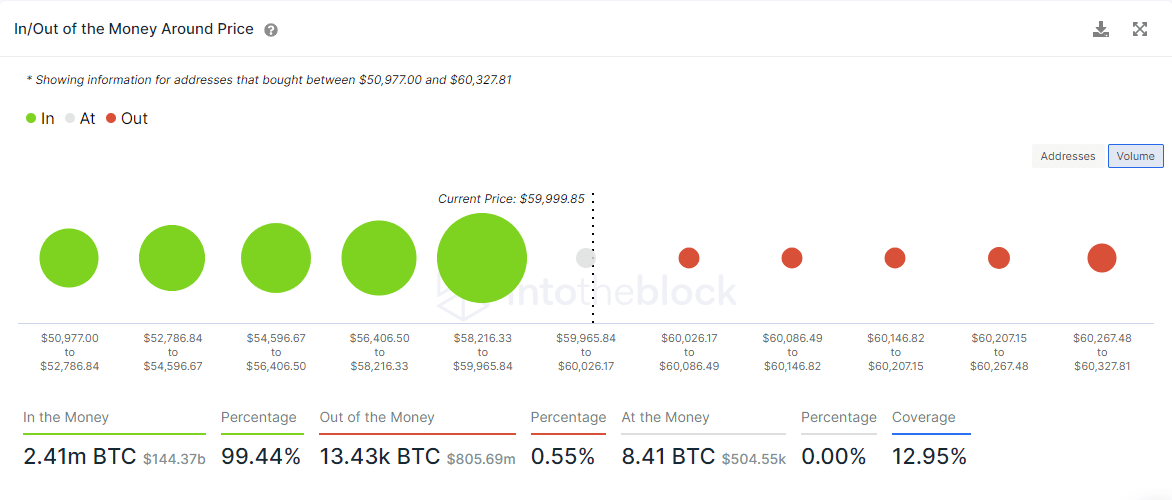
BTC IOMAP chart
There has been no limit to the announcements over the last two months, adding legitimacy to BTC. Still, the burgeoning enthusiasm has not budged the price, raising the possibility that the tremendous advance since last year has priced in the good news. Moreover, the hype has not arrested the slow decline in search interest on Google.
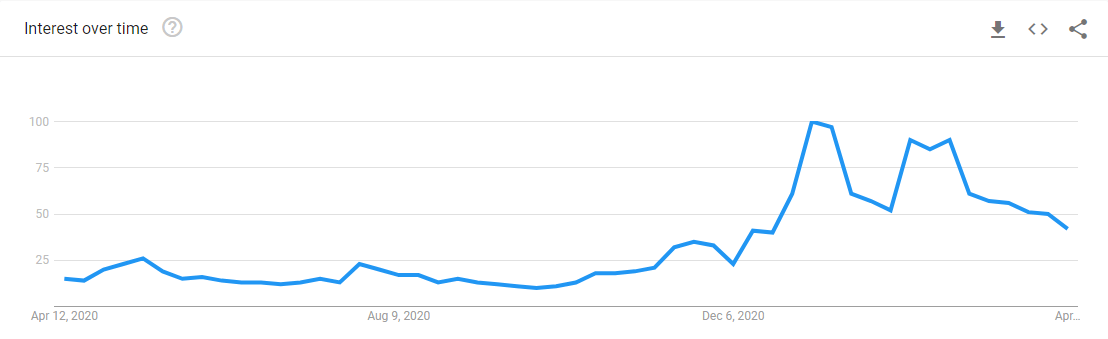
Source: Google Trends
Since the February high, the unfolding BTC price structure looks more like a rising wedge pattern with one more touch of the upper trend line needed to complete the pattern. It would represent a new marginal high for the flagship cryptocurrency near $67,300 and a test of the 361.8% Fibonacci extension of the 2017-2018 bear market.
Support should begin with the February high at $58,367, followed closely by the wedge’s lower trend line at $57,100 and the 50-day simple moving average (SMA) at $54,807.
The incremental support continues to the March low at $50,305 and then the 100-day SMA at $47,157, before a final test of the February low at $43,016.
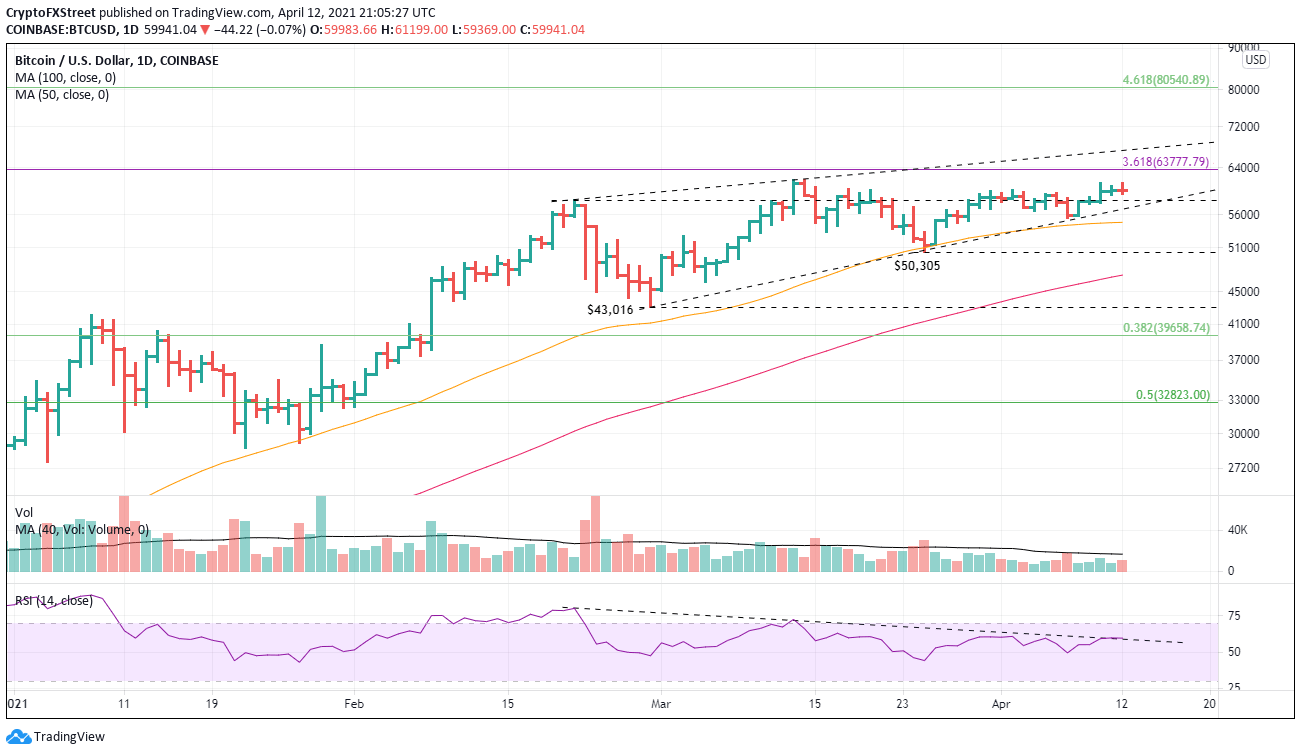
BTC/USD daily chart
It is also possible that the complex top ends up being a complex correction, and BTC slashes through the wedge’s upper trendline. The first significant resistance will be the 461.8% extension of the 2017-2018 bear market at $80,540. No more major resistance should appear until the psychologically huge $100,000.
Author

Sheldon McIntyre, CMT
Independent Analyst
Sheldon has 24 years of investment experience holding various positions in companies based in the United States and Chile. His core competencies include BRIC and G-10 equity markets, swing and position trading and technical analysis.


