Bitcoin price must avoid falling below this level, or BTC could flash-crash to $20,000
- Bitcoin price action remains extremely bearish.
- Critical support levels must hold, or BTC faces a major collapse.
- Upside potential remains a possibility, but bulls must show conviction.

Bitcoin price action closed Friday’s candlestick with the lowest daily close since January 24, 2022. Continued selling pressure and weakness remain the most likely behavior for Bitcoin until bulls decide to support BTC further.
Bitcoin price approaches major capitulation zone
Bitcoin price action may be hinting at a test of the final critical support level on its chart: $33,350. $33,350 is the 2021 Volume Point of Control. The VPOC is where the most buying and selling has occurred and is arguably one of the strongest levels of support and resistance in all technical analysis.
The position of $33,350 is at an extreme and has a shared value area with the 2021 and 2022 Volume Profiles. $33,350 is the 2022 Volume Profile low. For the 2021 Volume Profile, $33,350 is the Volume Point of Control and is just a hair above the 2021 lows. It is below $33,350 that real danger for longs exists.
Looking back to the 2020 Volume Profile shows that the next high volume node doesn’t appear until $20,000. This is important to recognize because analysts interpret price behavior with the Volume Profile. The expected behavior of Bitcoin price, if it spends any meaningful time below VPOC at $33,350, is a flash crash towards the next high volume node in the $20,000 - $24,000 value area.
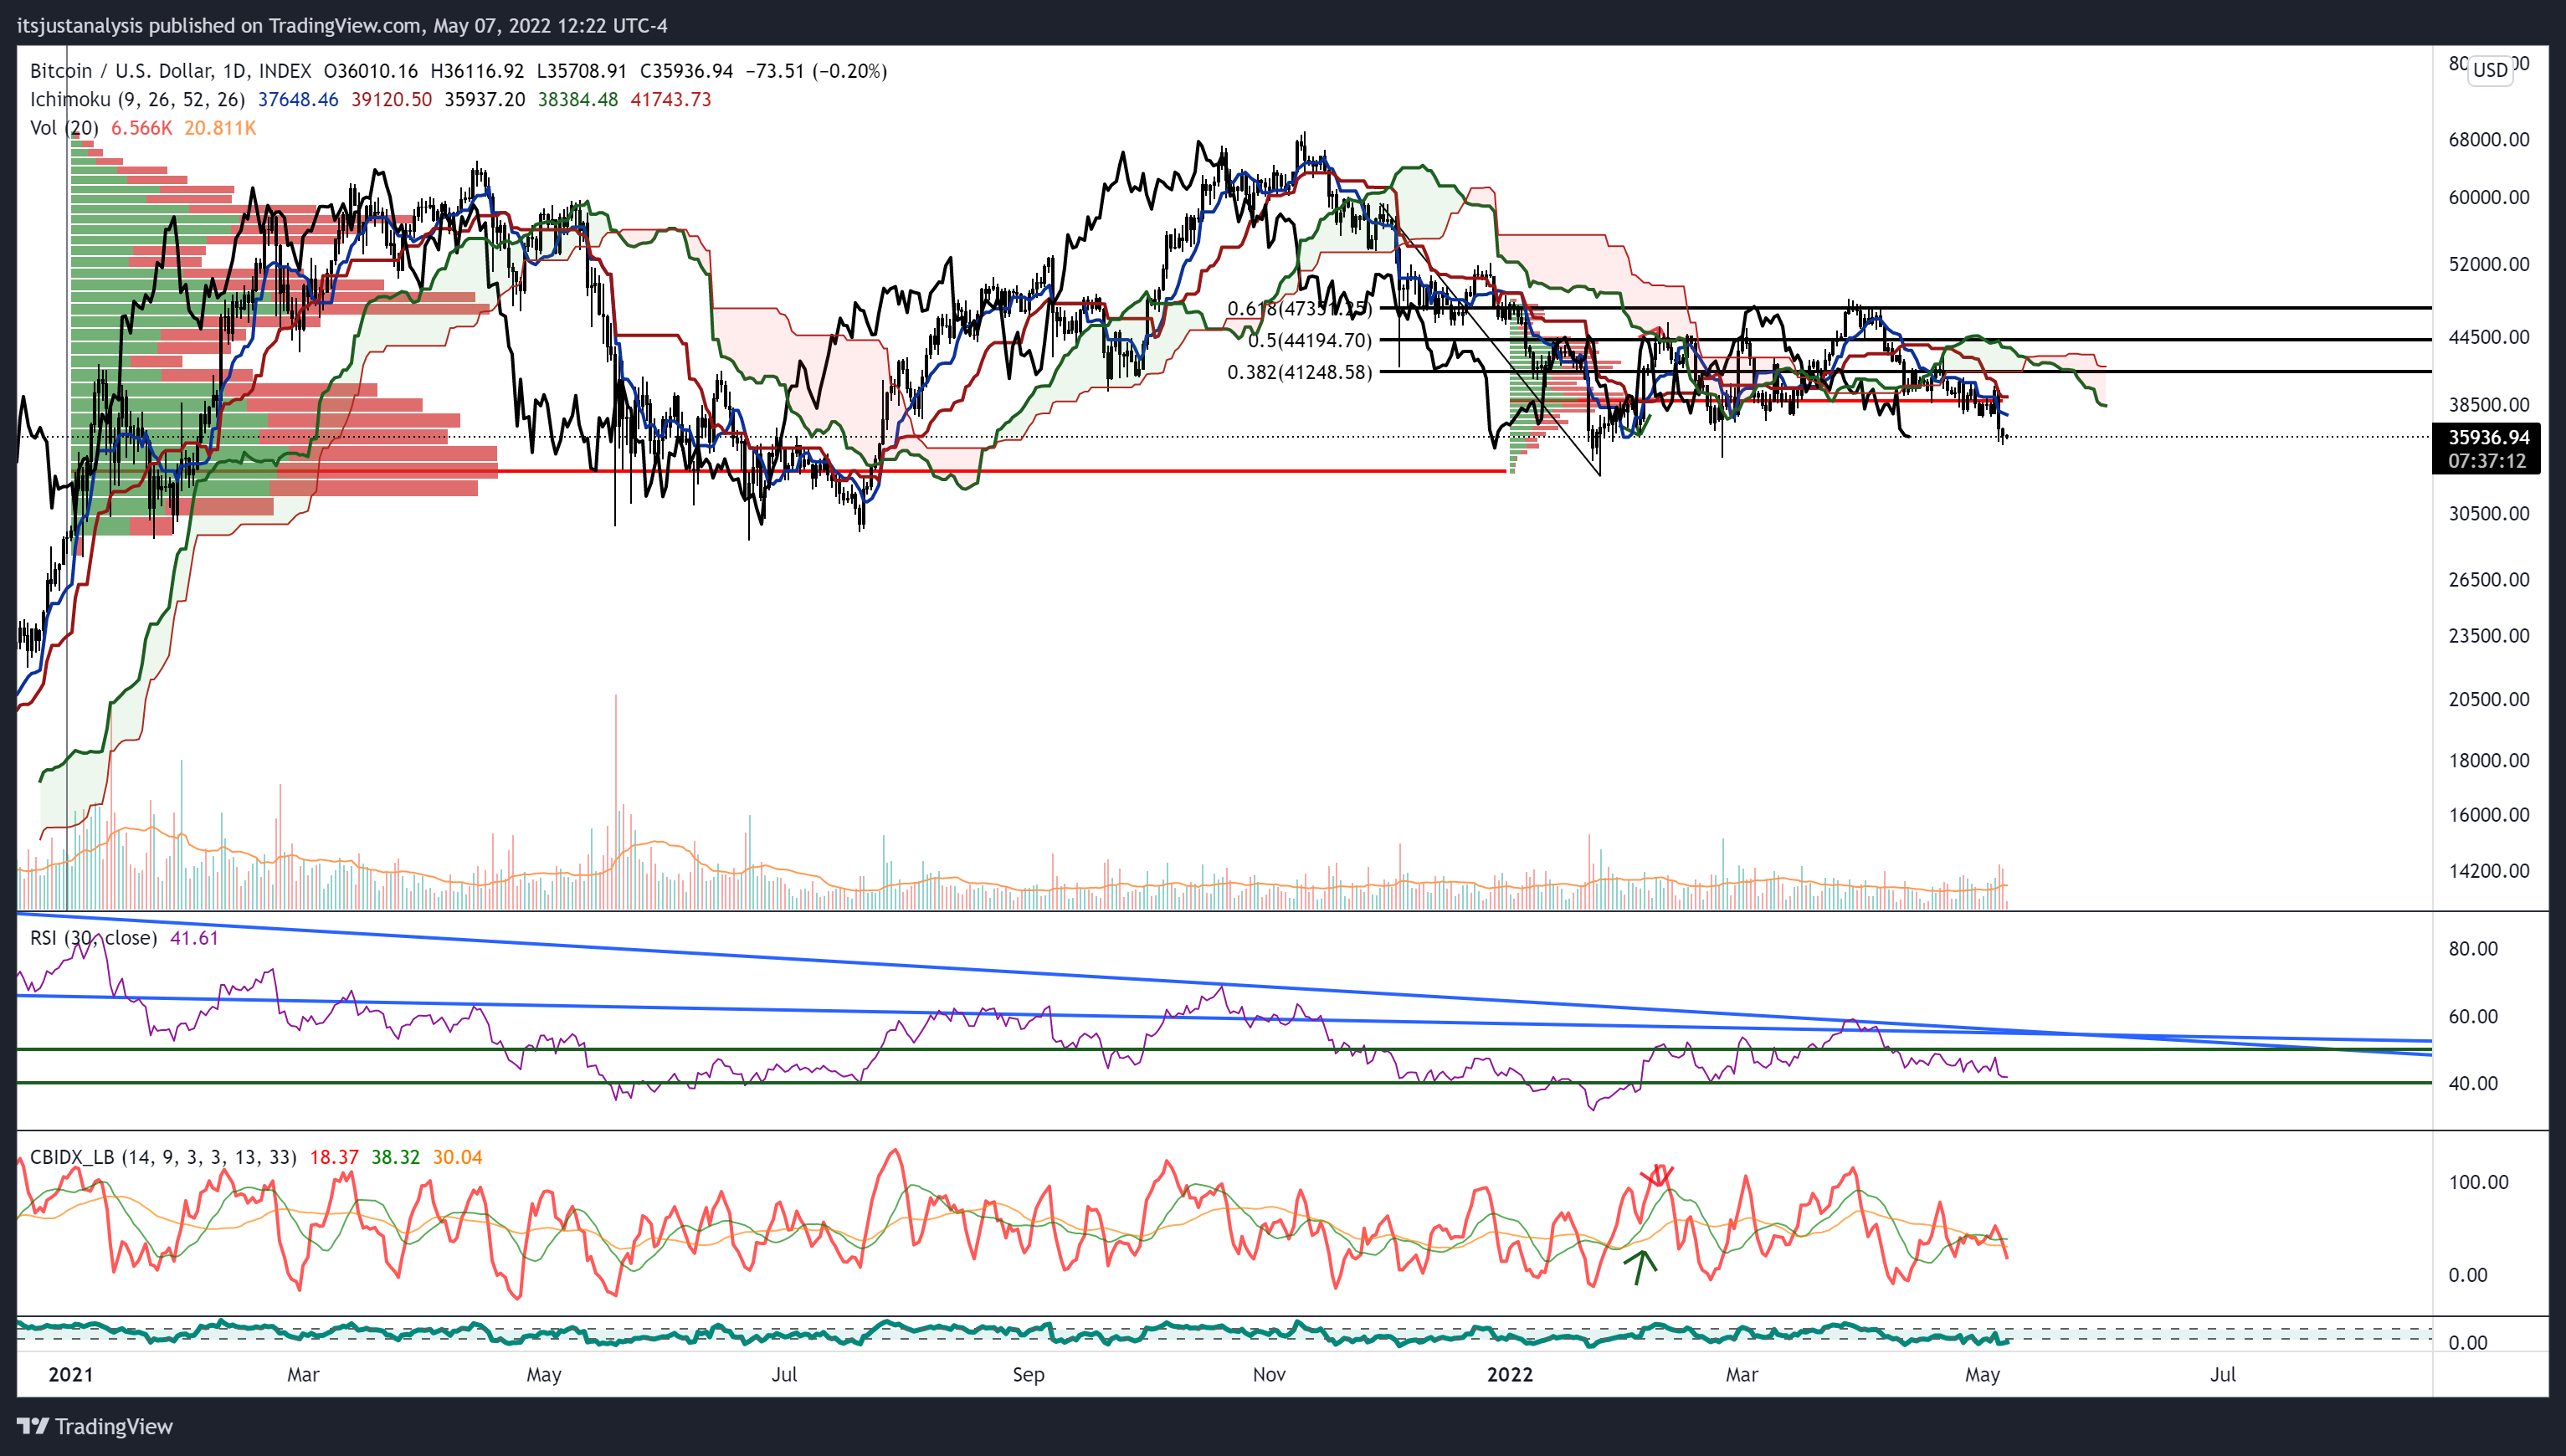
BTC/USD Daily Ichimoku Kinko Hyo Chart
If bulls want to deny any further downside risks or mitigate any immediate uncertainty, then they’ll need to complete one of two conditions. The first is to make sure the weekly candlestick closes above $36,859. If bulls fail to close at or above $36,859, then the Chikou Span on the weekly chart will close below the Ichimoku Cloud for the first time since May 18, 2018. It would also be only the third time if Bitcoin’s history that the Chikou Span has closed below the Ichimoku Cloud after a bull run.
A clear denial of any further downside momentum can be achieved by confirming an Ideal Bullish Ichimoku Breakout. This would only occur when Bitcoin price closes at or above $44,650.
Author

Jonathan Morgan
Independent Analyst
Jonathan has been working as an Independent future, forex, and cryptocurrency trader and analyst for 8 years. He also has been writing for the past 5 years.



