Bitcoin price looks like a scalpers market; here are the levels to be aware of
- Bitcoin price could run back up towards $44,000 to complete a head and shoulders pattern.
- BTC price is printing a bullish hammer on the daily chart.
- Invalidation is a breach below $36,400

Bitcoin price could go for a countertrend rally. The risky countertrend move could unfold impulsive as wave C of B.
Bitcoin price could rally up then back down again
Bitcoin price could continue to fake out traders as Smart Money has completed a successful liquidity hunt two Mondays in a row. The BTC price likely trapped traders looking to short the digital asset into $33,000. The BTC price could continue to rally higher in hopes of liquidating as many short traders as possible.
Bitcoin price trades at $40,166 after today's fakeout. If market conditions remain the same for the next few hours, the bulls will have established a bullish hammer candle which could spark a new uptrend rally for the Bitcoin price. The volume indicator profile looks poised for bullish price action after today's trading session.
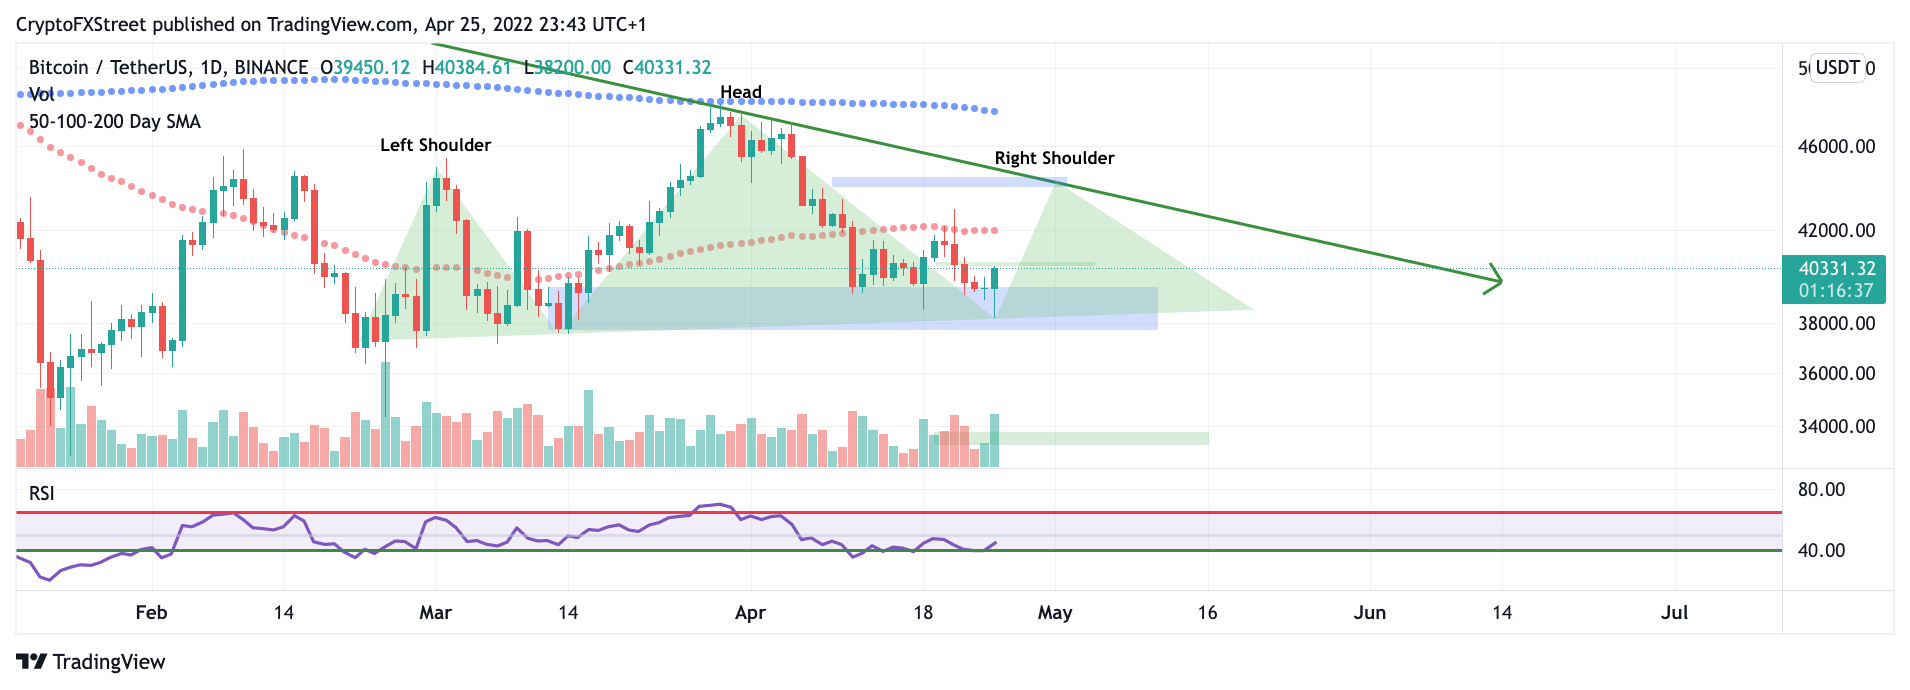
BTC/USDT 1-Day Chart
Analyzing the current downtrend scenario, the potential bull run into $44,000 would finish a very classical head and shoulders pattern. Traders should keep in mind the uptrend rally would be considered wave C of B within the pattern. Thus stronger drops could follow once the target is reached. Nonetheless, it is best to take this trade idea one step at a time.
Invalidation for the short-term bullish thesis is a breach below $36,400 which forecasts a 1-1 setup for traders aiming for the $44,000 target. If the bears manage to breach $36,400, the $33000 target would be the next bearish target resulting in up to a 17% drop from the current Bitcoin price.
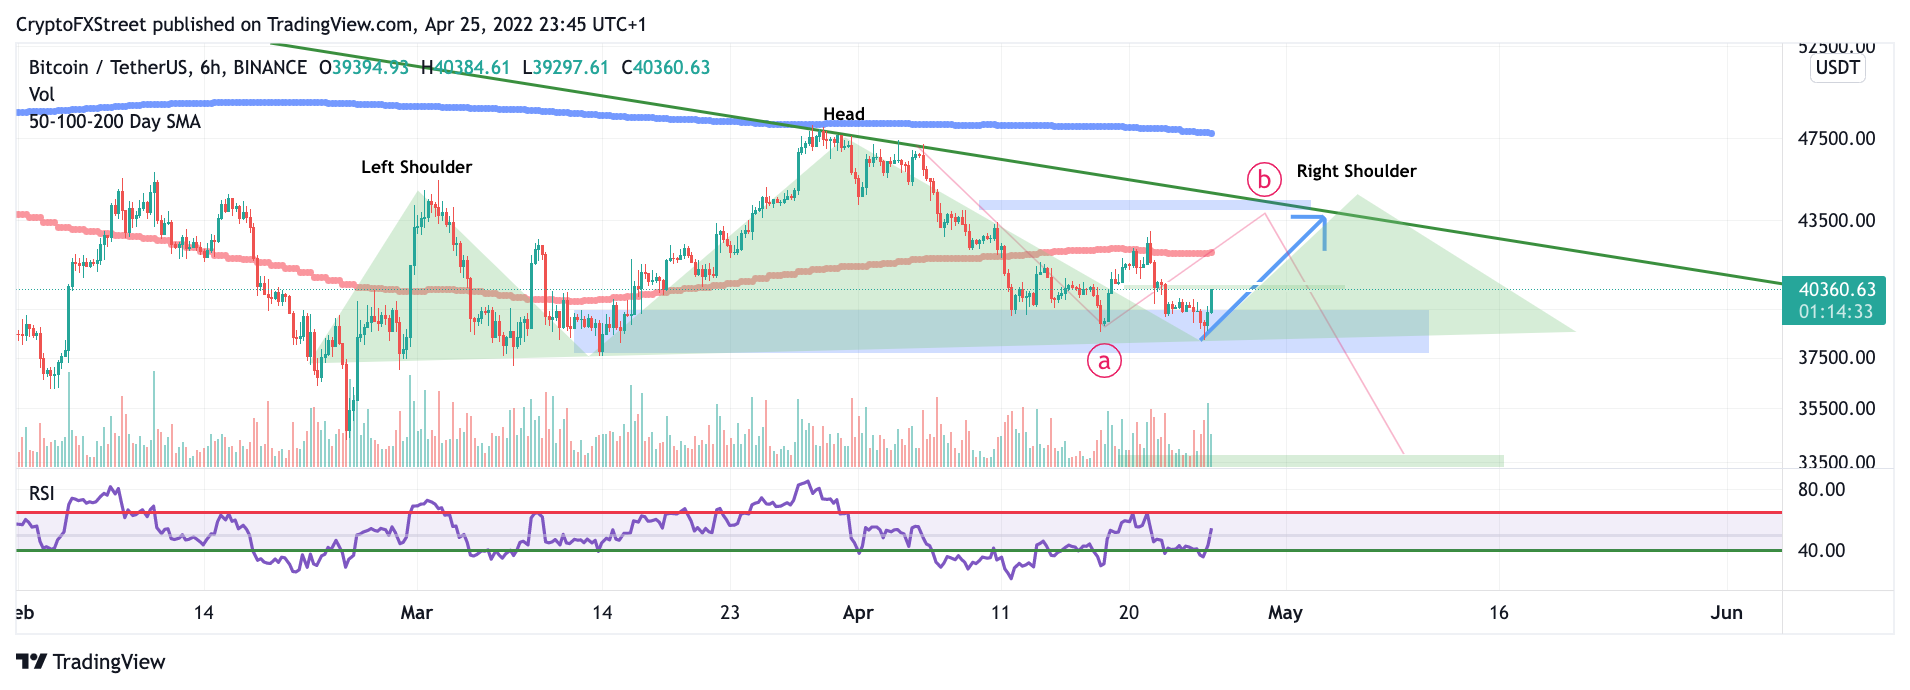
BTC/USDT 4-Hour Chart
Author

Tony M.
FXStreet Contributor
Tony Montpeirous began investing in cryptocurrencies in 2017. His trading style incorporates Elliot Wave, Auction Market Theory, Fibonacci and price action as the cornerstone of his technical analysis.


