Bitcoin Price Forecast: BTC flirts with $100K as market sentiment improves on Trump trade deal with the UK
- Bitcoin price nears $100,000 on Thursday after rallying for three consecutive days this week.
- The rally was fueled by Donald Trump's announcement of a major trade deal with a major nation, reportedly the United Kingdom.
- The technical outlook suggests a continuation of the rally targeting the $105,000 mark.

Bitcoin (BTC) price extends its gains, nearing the $100,000 level at the time of writing on Thursday, after rallying for three consecutive days this week. The most recent uptick was fueled by Donald Trump's announcement of a “major trade deal” that, according to the Wall Street Journal, is with the United Kingdom (UK). The technical outlook suggests a continuation of the rally targeting the $105,000 mark.
Bitcoin nears $100,000 as Trump announces trade deal
US President Donald Trump announced on his Truth Social account that a “major trade deal” had been reached, which would mark the first such agreement to be announced since he imposed tariffs on dozens of America's trading partners.
Trump said on the Truth Social platform that he would hold a news conference at 10:00 in Washington, DC (15:00 BST), to announce an agreement with "representatives of a big, and highly respected, country."
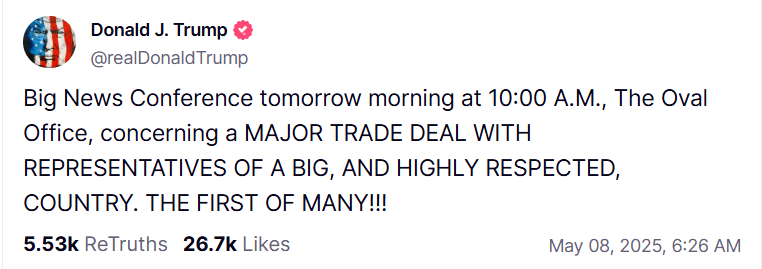
This news announcement fuels the largest cryptocurrency by market capitalization, which is flirting around $100,000 during the European trading session on Thursday, a level not seen in the last 90 days. Tariff deals with major countries would ease the ongoing uncertainty in the global economy, improving market sentiment and benefiting risk assets such as Bitcoin.
Bitcoin Price Forecast: BTC bulls aim for $105,000 before reaching an all-time high
Bitcoin price was rejected from its daily resistance level of $97,700 on Friday and declined 2.89% over the weekend. However, at the start of this week, it recovered from its pullback and continued rising through Wednesday. At the time of writing on Thursday, it breaks above the $97,000 and continues to trade near $100,000.
If BTC continues its upward trend, it could extend the rally toward its key psychological importance level at $105,000 before rallying to its all-time high at $109,588.
The Relative Strength Index (RSI) on the daily chart moves above its overbought level of 70, indicating strong bullish momentum. However, traders should be cautious as the chances of a pullback are high due to its overbought condition. Another possibility is that the RSI remains above its overbought level of 70 and continues its upward trend.
The Moving Average Convergence Divergence (MACD) indicator on the daily chart coils against each other. If the MACD shows a bullish crossover, it would give buying signals and indicate an upward trend.
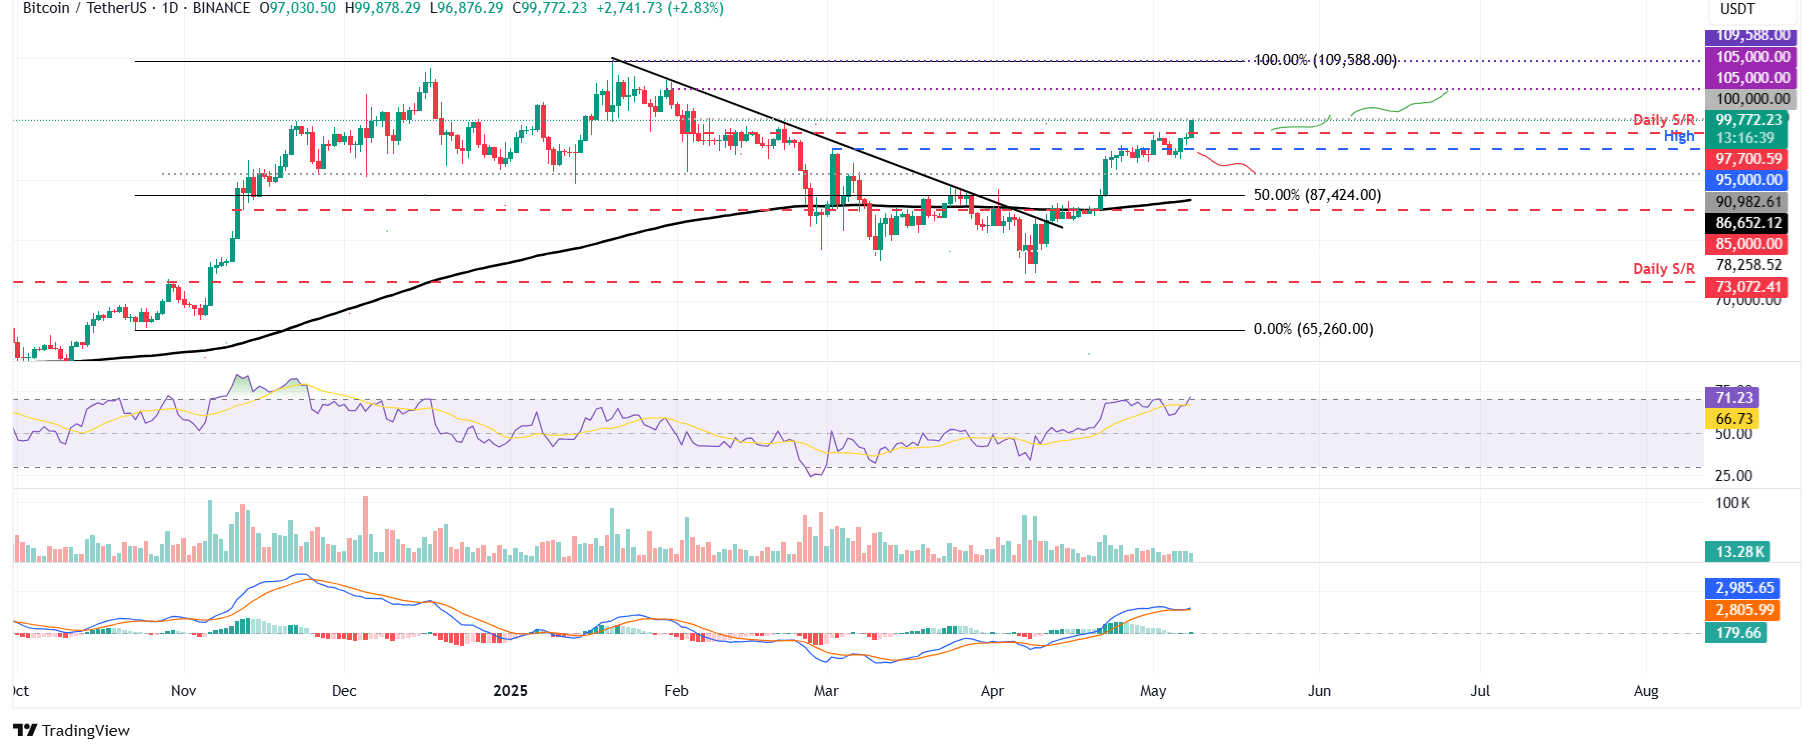
BTC/USDT daily chart
However, if BTC faces a pullback, it could extend the decline to retest its next support level at $97,700.
Author

Manish Chhetri
FXStreet
Manish Chhetri is a crypto specialist with over four years of experience in the cryptocurrency industry.




