Bitcoin Price Forecast: BTC eyes $120,000 as prospects of Fed rate cuts fuel market optimism
- Bitcoin price stabilizes around 111,000 on Thursday after hitting a record high of nearly $112,000 the previous day.
- Fed Minutes spark renewed risk-on sentiment as it showed officials foresee interest rate cuts later this year, boosting momentum across markets.
- BTC’s on-chain data shows a decline in retail holdings and fresh inflows into spot Bitcoin ETFs.

Bitcoin (BTC) price is holding broadly steady at around $111,000 at the time of writing on Thursday after hitting a new all-time high of nearly $112,000 the previous day. The price surge in the largest cryptocurrency by market capitalization was supported by signals that Federal Reserve (Fed) officials consider cutting interest rates later this year, triggering risk-on sentiment across the crypto market.
Moreover, on-chain data indicate a decline in retail holdings and new inflows into spot Bitcoin Exchange-Traded Funds (ETFs), suggesting a further rally toward the $120,000 level.
Fed’s Minutes act as catalyst for Bitcoin
Bitcoin price consolidation phase came to an end during the American trading session on Wednesday, hitting a new all-time high (ATH) of $111,999. This renewed optimism was fueled by the Fed’s Minutes that day. The Federal Open Market Committee (FOMC) meeting minutes included a few officials who expressed the view that interest rates might decrease as early as July. At the same time, the majority of policymakers continued to have concerns regarding the inflationary pressures anticipated from US President Donald Trump's implementation of import taxes aimed at altering global trade.
The short-term stance in the meeting minutes has triggered a risk-on sentiment, which supports the price rally in cryptos, with the largest cryptocurrency reaching an all-time high. However, traders now look forward to the release of fresh US labor market-related data on Thursday and speeches by Fed officials to provide a fresh directional impetus to the top cryptocurrency by market capitalization.
Bitcoin retail offloads while institutional loads BTC
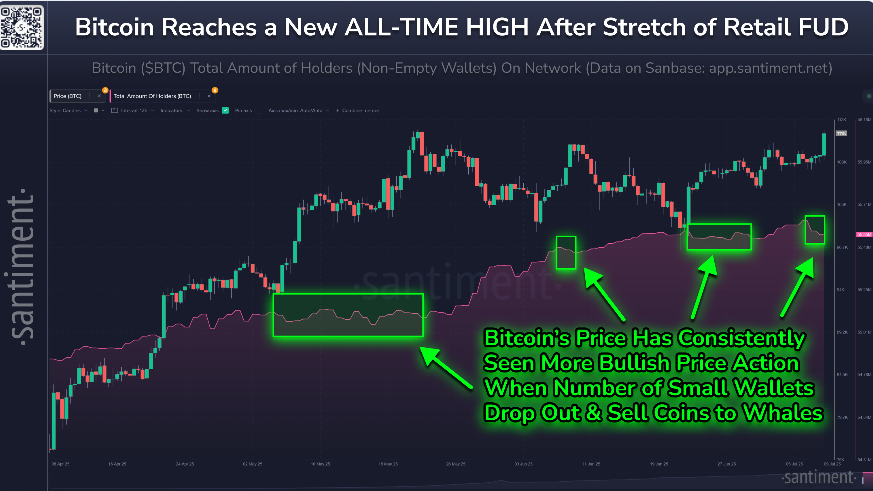
Santiment data indicates that the wallets of BTC retail investors have been draining due to boredom or a lack of confidence over the past few days, as illustrated in the chart below. Historically, the crypto markets have typically moved in the opposite direction of the crowd's expectations. When retail shows Fear, Uncertainty, and Doubt (FUD), these are usually prime spots for smart money to move in and accumulate.
SoSoValue data provides a clear picture of what institutions, are doing. As shown in the chart below, the spot Bitcoin ETFs recorded an inflow of $218.04 million on Wednesday, continuing its four-day streak of inflow since July 2. So far this month, institutions have accumulated $1.18 billion in inflows, continuing their four-month streak of positive flows since April.
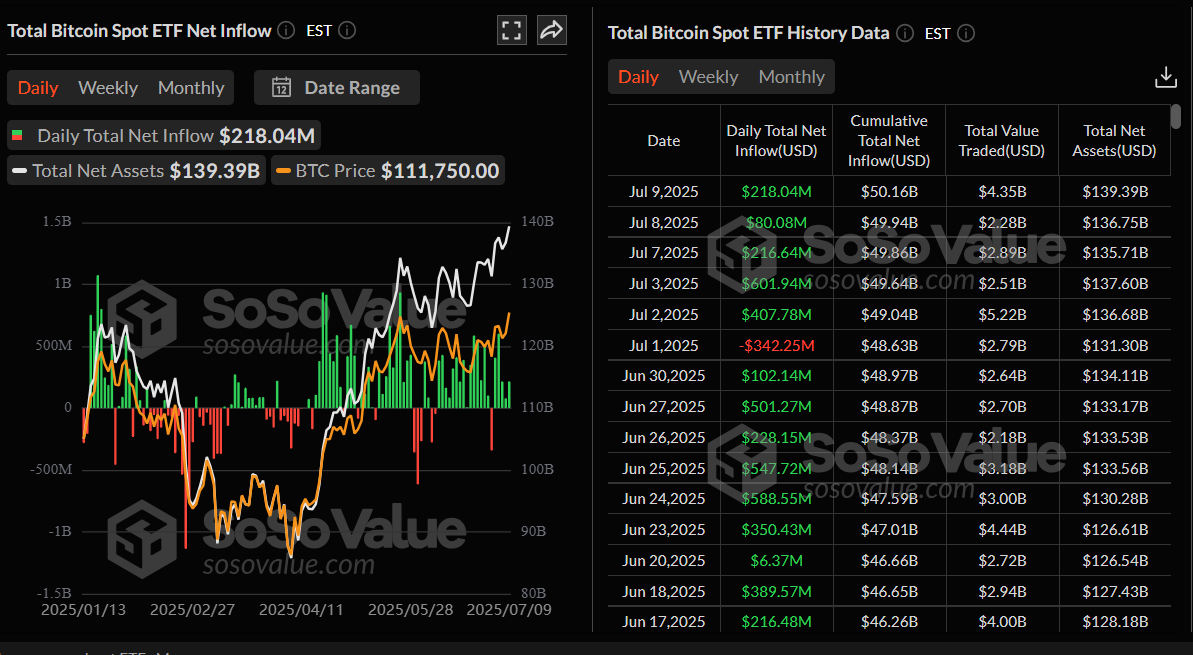
Total Bitcoin spot ETF net inflow daily chart. Source: SoSoValue
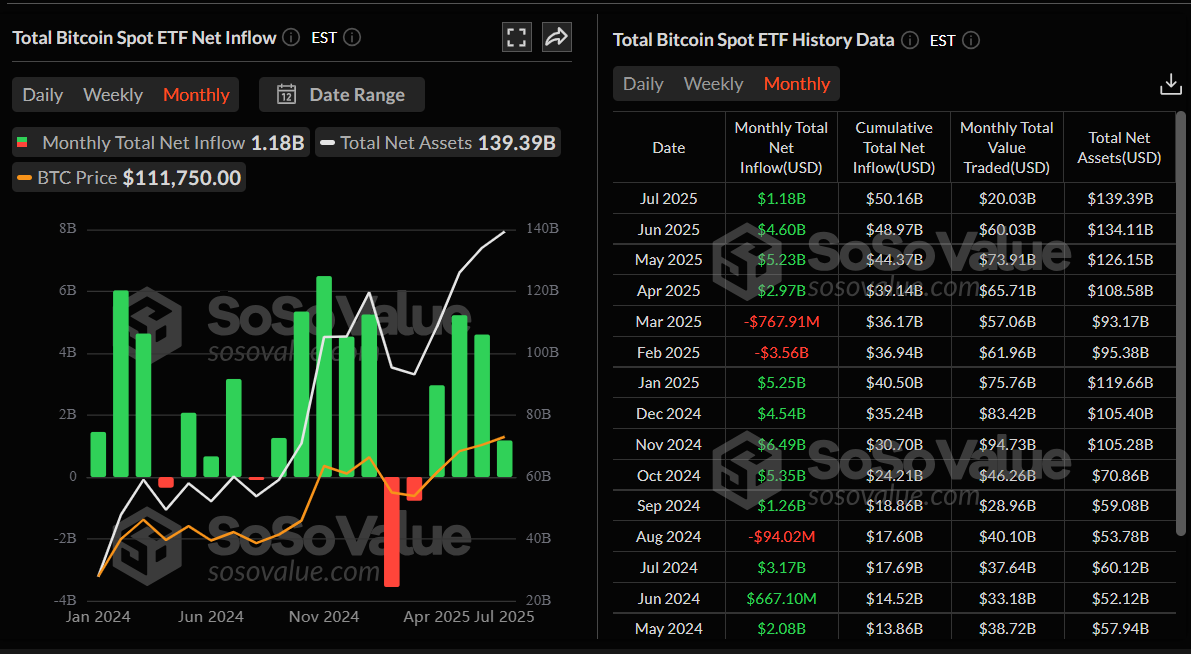
Total Bitcoin spot ETF net inflow monthly chart. Source: SoSoValue
Bitcoin derivatives data shows a bullish bias
Bitcoin’s derivatives data also shows a bullish picture. CoinGlass BTC’s Open Interest (OI) has increased by 8.07% over the last 24 hours, reaching $79.45 billion, nearing its May 23 record high of $81.09 billion. An increasing OI represents new or additional money entering the market and new buying, which could fuel the current BTC price rally.
The rising optimism in Bitcoin has triggered a wave of liquidations of nearly $234.08 million in the last 24 hours, with $221.27 million of these being short positions. With the wipeout of massive short positions, the long-to-short ratio for BTC reads 1.06 on Thursday. This ratio, above one, reflects bullish sentiment in the markets, as more traders are betting on the asset price to rally.
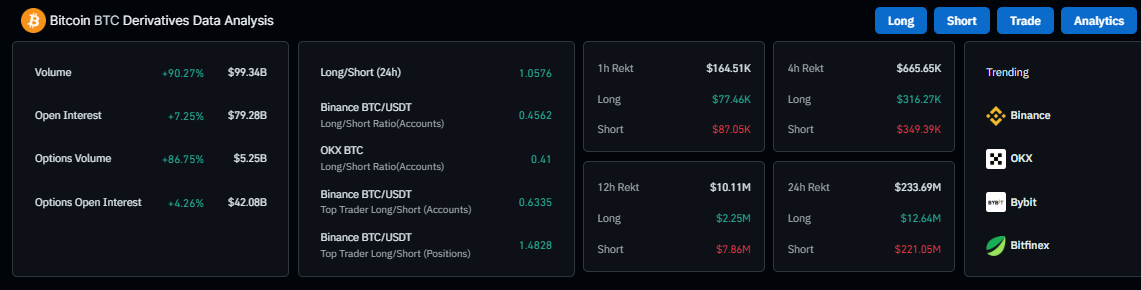
Bitcoin derivatives chart. Source: Coinglass
Looking down at the Bitcoin Exchange Liquidation Map reveals that nearly $2.5 billion of Bitcoin shorts are set to be liquidated if BTC reaches $120,000, which could trigger a short squeeze and further fuel the rally.
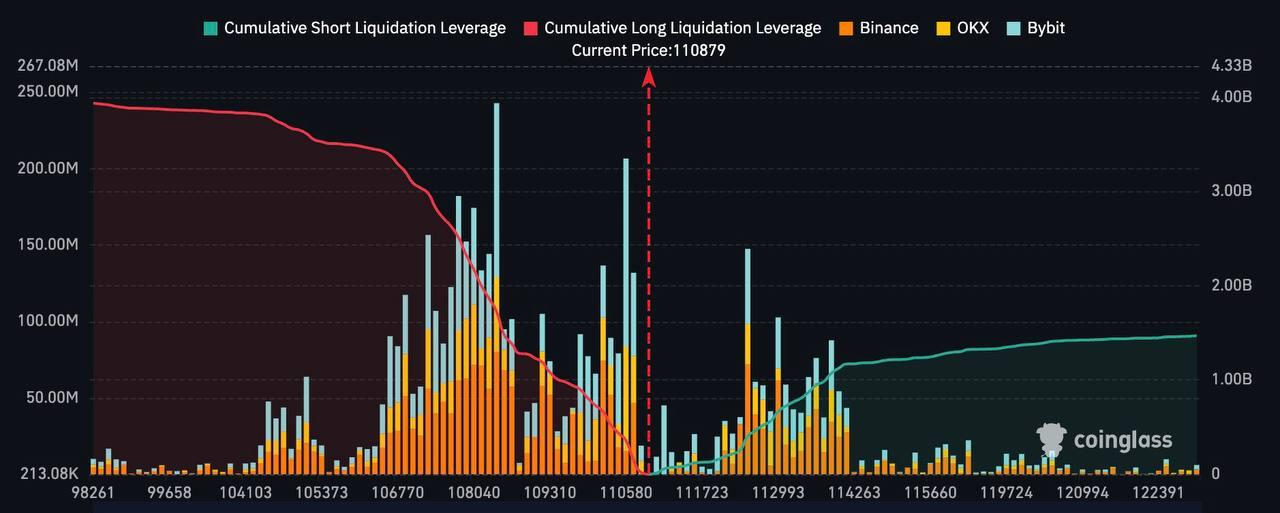
Bitcoin Exchange Liquidation Map chart. Source: Coinglass
Bitcoin Price Forecast: BTC in price discovery mode
Bitcoin price consolidation around the upper boundary of a previously broken consolidation zone at $108,355 came to an end after it reached a new all-time high of $111,999 on Wednesday. At the time of writing on Thursday, it hovers around $111,000.
As BTC enters into a price discovery mode, and if the upward trend continues, it could extend the rally toward its key psychological level of $120,000.
The Relative Strength Index (RSI) on the daily chart reads 61, above its neutral level of 50, indicating bullish momentum. The Moving Average Convergence Divergence (MACD) indicator displayed a bullish crossover at the end of June. It also shows rising green histogram bars above its neutral zero line, suggesting bullish momentum is gaining traction and continuing an upward trend.
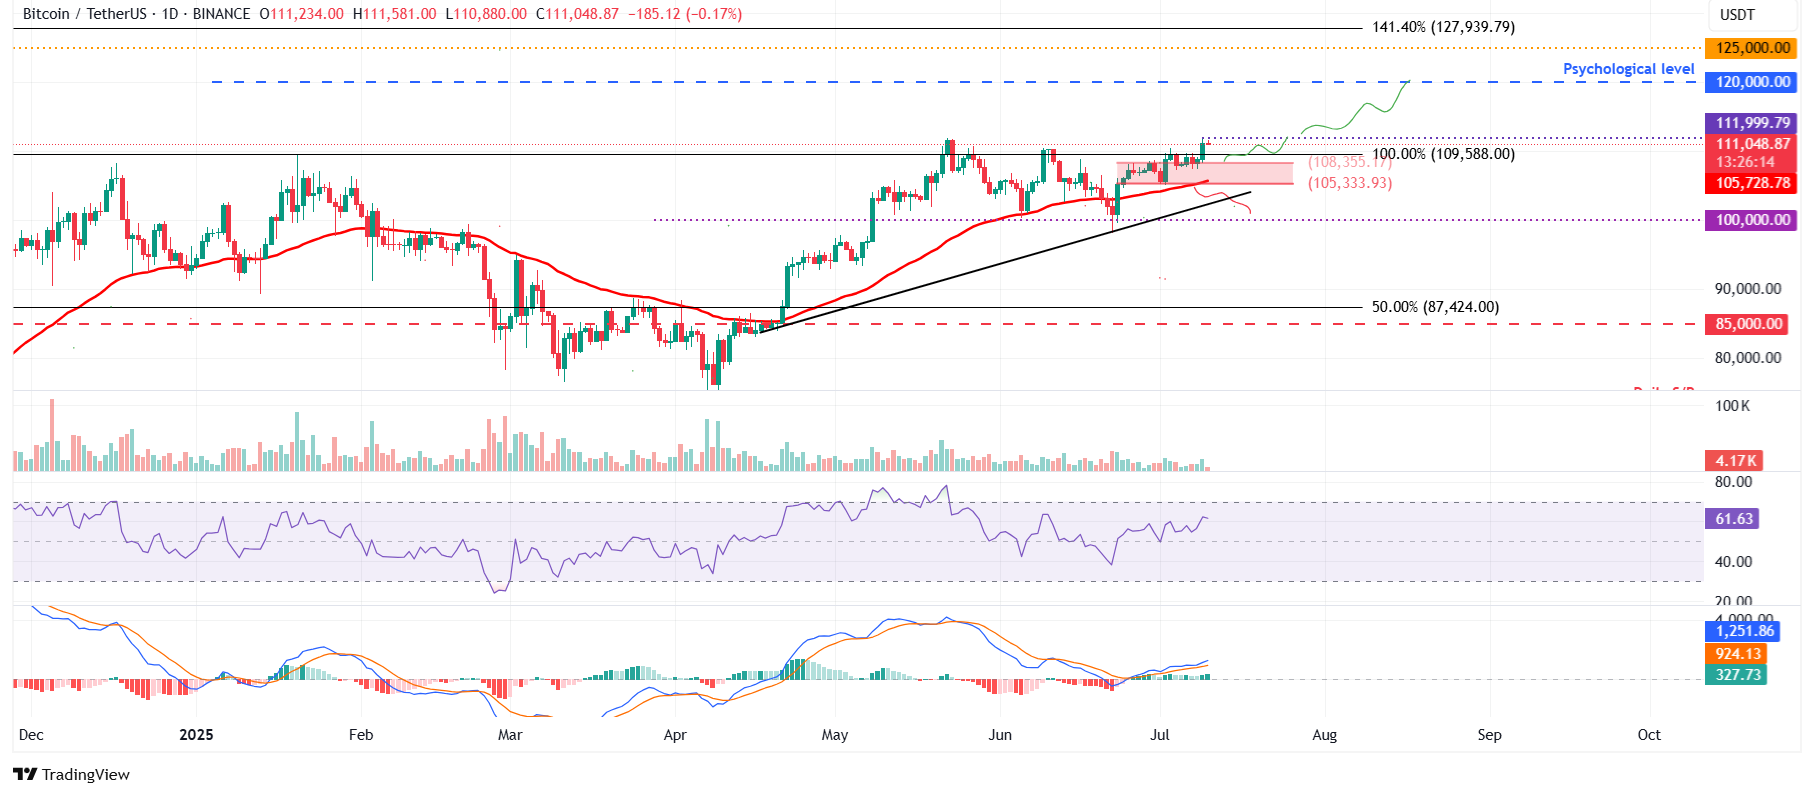
BTC/USDT daily chart
However, if BTC faces a correction, it could extend the decline to find support around the upper boundary of a previously broken consolidation zone at $108,355.
Author

Manish Chhetri
FXStreet
Manish Chhetri is a crypto specialist with over four years of experience in the cryptocurrency industry.


