|

Bitcoin Price Analysis: Path of least resistance appears to the downside

  • BTC/USD’s recovery attempts remain capped below 7000.
  • Bitcoin trapped in a symmetrical triangle on 15-minutes chart.
  • The near-term outlook appears neutral to bearish.

Bitcoin (BTC/USD), the most favorite cryptocurrency, stalled its gradual recovery from a five-day low of 6750.92 reached Friday after facing rejection once again near 6950 region earlier this Saturday. Since then, the price has been holding the lower ground, as the bulls lack followthrough momentum amid thin trading, given the Easter weekend. At the press time, Bitcoin is off the daily lows of 6850, trading flat around 6890, with a market capitalization of $126.00 billion.

Technical Overview

BTC/USD 15–mins chart

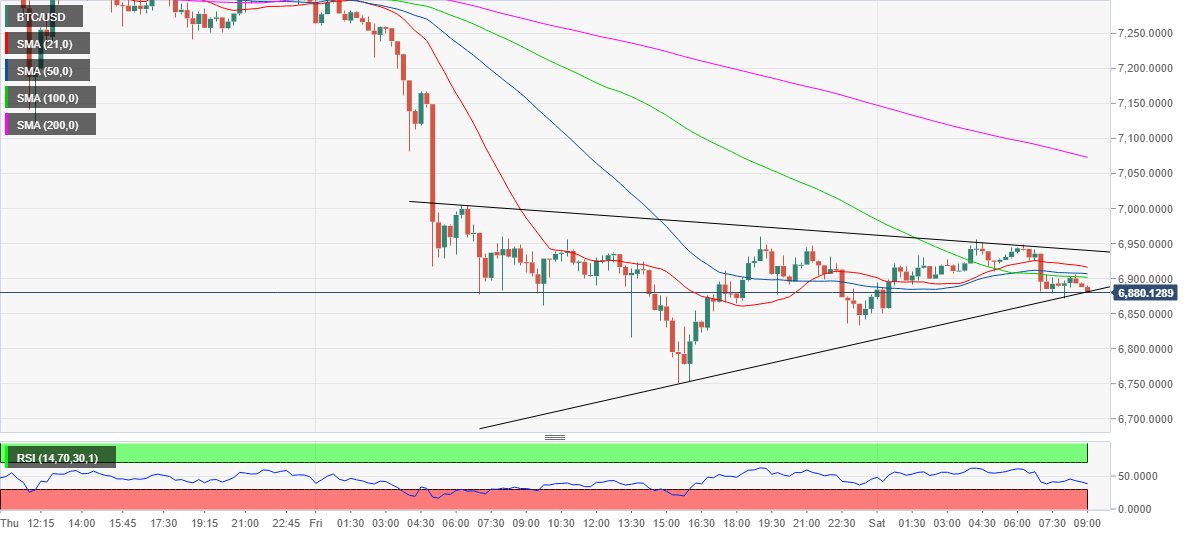
Technically, the 15-minutes chart displays a symmetrical triangle formation, with the BTC bears now teasing the breakdown near the trendline support of the potential formation at 6879. Should the bulls fail to resist the last, a sharp selling wave could knock-off the coin to Friday’s low. On the way southwards, the next support comes in at 6625, the pattern target.

Alternatively, if the pattern doesn’t get confirmed, the bulls could try to take out the immediate hurdle around the 6910-20 region, the confluence of the 21, 50 and 100-bar Simple Moving Averages (SMA). Further up, the next resistance awaits at the descending trendline, now at 6940.

To conclude, the path of least resistance appears to the downside, with the Relative Strength Index (RSI) inching lower towards the oversold territory below the midline.

BTC/USD technical levels to watch

BTC/USD

Overview
Today last price6887.70
Today Daily Change13.70
Today Daily Change %0.20
Today daily open6874.05
 
Trends
Daily SMA206690.41
Daily SMA507322.97
Daily SMA1008147.99
Daily SMA2008084.77
 
Levels
Previous Daily High7305.47
Previous Daily Low6750.92
Previous Weekly High7468.81
Previous Weekly Low6681.12
Previous Monthly High9215.51
Previous Monthly Low3886.49
Daily Fibonacci 38.2%6962.76
Daily Fibonacci 61.8%7093.63
Daily Pivot Point S16648.16
Daily Pivot Point S26422.27
Daily Pivot Point S36093.61
Daily Pivot Point R17202.71
Daily Pivot Point R27531.36
Daily Pivot Point R37757.26

Author

Dhwani Mehta

Dhwani Mehta

FXStreet

Residing in Mumbai (India), Dhwani is a Senior Analyst and Manager of the Asian session at FXStreet. She has over 10 years of experience in analyzing and covering the global financial markets, with specialization in Forex and commodities markets.

More from Dhwani Mehta
Share:

Editor's Picks

Ripple extends losses as derivatives interest cools

Ripple (XRP) extends its bearish roll near $1.12 support on Friday, reflecting intense headwinds in the broader crypto market largely attributable to macroeconomic pressure.

Crypto Today: Bitcoin, Ethereum, XRP weaken further as capital outflows persist

Macroeconomic headwinds continue to weigh heavily on the cryptocurrency market on Friday, prompting major assets like Bitcoin (BTC) to pare earlier gains and extend losses after June’s brief relief rally.

Bitcoin Weekly Forecast: Recovery hopes fade after the Fed spoils the party

Bitcoin is set to end the week in the red, trading near the 200-Week Simple Moving Average at around $62,300 on Friday. Institutional selling persists, capping BTC’s recovery as spot Exchange Traded Funds point to a sixth consecutive week of outflows.

Sui risks a deeper bearish leg despite on-chain resilience

Sui is down 2% on Friday, extending its decline toward the recent support leg formed at $0.6618. The Total Value Locked in the Sui ecosystem has stabilized around 600 million SUI tokens, reflecting resilient user demand.

Bitcoin: Recovery hopes fade after the Fed spoils the party
Bitcoin (BTC) is set to end the week in the red, trading near the 200-Week Simple Moving Average (SMA) at around $62,300 on Friday. Institutional selling persists, capping BTC’s recovery as spot Exchange Traded Funds (ETFs) point to a sixth consecutive week of outflows.