- “You are taking on a lot of risk with no recourse if things go wrong,” Tony Richards told the Australian Business Economists.
- Technical indicators signal higher corrections in the short-term.
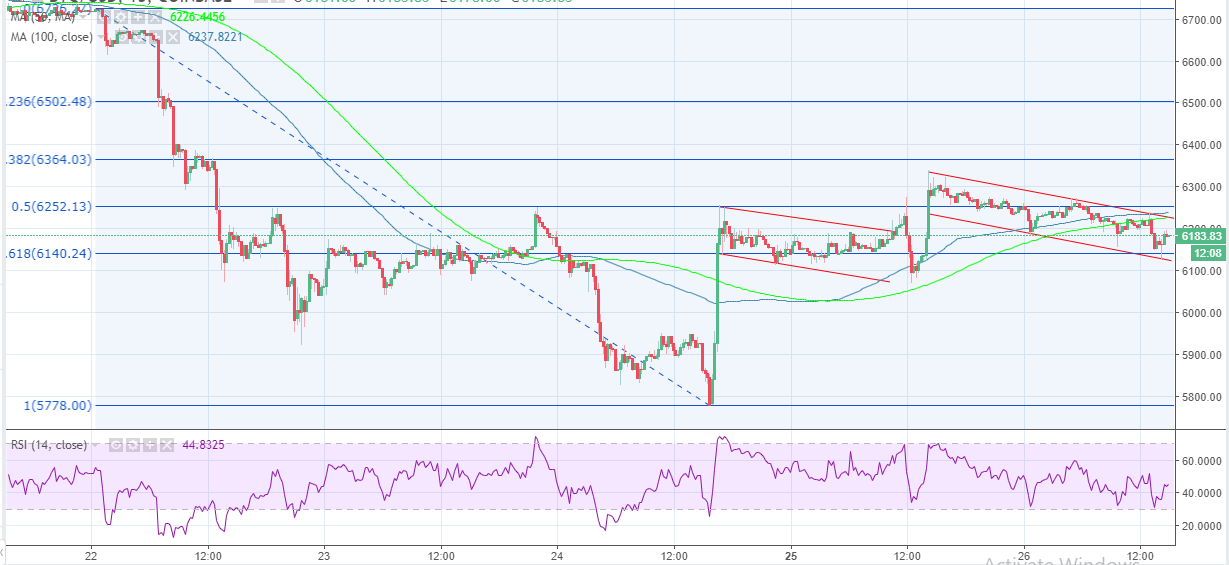
Bitcoin price is still trading within the bullish flag pattern explored in an earlier price analysis. The price is still strongly bearish although it is supported at $6,140. BTC/USD has tanked at least 1% on the day, besides it opened the trading session at $6247.95, but it is now changing hands slightly above $6,180.
The digital assets introduced another new perspective of money in the global economies. However, many central banks still maintained that Bitcoin and other virtual currencies can be utilized as a form of money. The Reserve Bank of Austria (RBA) still holds that Bitcoin is not mature enough to be used as a currency. The Payments Policy head at RBA, Tony Richards said in a comment:
“Indeed, even if one is quite skeptical of whether Bitcoin will have a significant role in the economy in the future, I think it is hard to avoid some admiration for its design.”
Richard was talking to Australian Business Economists on the risks involved with trading digital assets. “You are taking on a lot of risk with no recourse if things go wrong,” he reckoned. He also touched on the recent attacks on cryptocurrency exchanges and including the Parity Hack. Richard said:
“These risks acknowledged, cryptocurrencies and distributed ledgers are fascinating developments both from a payments and a broader economic perspective. There have been a lot of cryptocurrency hacks and there are a lot of risks there. With Bitcoin, the only regulation to date has been AML. There hasn’t been any regulation in any country, that I’m aware of, that speaks to the question of investor protection,”
Bitcoin price analysis
At the moment, there is a weak bullish momentum that is shaping up on the chart. The technical indicators like the stochastic and the RSI are sending bullish signals in the short-term. The gap between the 100 SMA and the shorter term 50 SMA is narrowing to confirm the upward momentum. $6,200 is a key resistance (intraday) but $6,300 is a significant hurdle towards $6,400. The 61.8% Fib retracement level with the last swing high of $6,725 and a $5,777 is providing immediate support at $6,140. The short-term bullish flag pattern will also offer support above $6,100.
BTC/USD 15’ chart
Information on these pages contains forward-looking statements that involve risks and uncertainties. Markets and instruments profiled on this page are for informational purposes only and should not in any way come across as a recommendation to buy or sell in these assets. You should do your own thorough research before making any investment decisions. FXStreet does not in any way guarantee that this information is free from mistakes, errors, or material misstatements. It also does not guarantee that this information is of a timely nature. Investing in Open Markets involves a great deal of risk, including the loss of all or a portion of your investment, as well as emotional distress. All risks, losses and costs associated with investing, including total loss of principal, are your responsibility. The views and opinions expressed in this article are those of the authors and do not necessarily reflect the official policy or position of FXStreet nor its advertisers. The author will not be held responsible for information that is found at the end of links posted on this page.
If not otherwise explicitly mentioned in the body of the article, at the time of writing, the author has no position in any stock mentioned in this article and no business relationship with any company mentioned. The author has not received compensation for writing this article, other than from FXStreet.
FXStreet and the author do not provide personalized recommendations. The author makes no representations as to the accuracy, completeness, or suitability of this information. FXStreet and the author will not be liable for any errors, omissions or any losses, injuries or damages arising from this information and its display or use. Errors and omissions excepted.
The author and FXStreet are not registered investment advisors and nothing in this article is intended to be investment advice.
Recommended Content
Editors’ Picks
Ripple's move above this key level could trigger nearly 50% rally for XRP
Ripple has overcome a critical resistance level and flipped into a support floor on the weekly time frame. This development happened while XRP tightly consolidated for roughly 250 days. Investors can expect XRP to kickstart a massive rally.
Optimism price outlook with nearly $90 million worth of OP tokens flooding markets on Friday
Optimism volatility has shrunk in the ours leading to the network’s cliff unlock. It joins the likes of dYdX and Sui, which have similar events on their calendars. As token unlocks are often considered bearish catalysts, investors should brace for a reaction after the event.
Top 3 Price Prediction Bitcoin, Ethereum, Ripple: Retail watches from the sidelines with a bias for shorts
Bitcoin could clear $73,777 peak as BTC bulls resurface. Ethereum might fall 10% before next leg up as ETH RSI teases with sell signal. XRP could lose $0.6000 threshold as Ripple bulls fail to show up.
Jito price could hit $6 as JTO coils up inside this bullish pattern
Jito price action shows a potential cup and handle formation. Based on theoretical measurement rules, a successful breakout could yield a 56% rally to $6.0. A breakdown of the $3.86 support level would create a lower low for JTO and invalidate the bullish thesis.
Bitcoin: BTC may have recovered, but is it out of the woods?
Bitcoin’s (BTC) upward momentum has shown a significant decline for the past two weeks or so. This development led to a bearish signal on the weekly and an uncertain outlook on the monthly.