Bitcoin Price Analysis: BTC/USD journey back to $9,000 in jeopardy as sellers’ grip tightens – Confluence Detector


  • Bitcoin price unable to clear the resistance at $8,882 delaying recovery to levels above $9,000.
  • BTC/USD buyers worried that another test at $8,698 support could lead to a breakdown towards $8,000.

Bitcoin has remained lethargic in its price performance since the beginning of the week. It is becoming increasingly difficult to sustain gains above $9,000. On the other hand, buyers are concentrating on defending the short term support at $8,800. Meanwhile, BTC/USD is valued at $8,840, following a minor retreat from $8,893 (intraday high).

The 4-hour chart shows Bitcoin trading below the moving averages. The 50 SMA has also slipped under the 100 SMA to show that bears have the upper hand. If the gap between the moving averages continues to grow, BTC/USD would breakdown further and even test last week’s support at $8,600. Consequently, the price continues to correct lower within a descending channel. While the channel resistance gives the bulls a difficult time trying to navigate it, the channel support continues to mitigate the losses targeting $8,000.

Read also: Cryptocurrency Market News: Bitcoin and crypto bullish cycle impends as governments pad economies

BTC/USD 4-hour chart

BTC/USD price chart

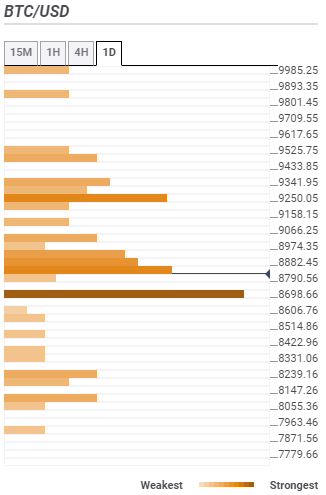
Bitcoin confluence resistance and support levels

According to the confluence detector tool, Bitcoin’s initial task is to break the hurdle at $8,882. The resistance zone is home to the SMA 50 15-mins, SMA 50 1-hour, the Bollinger Band 15-minutes middle curve, the previous low 1-hour, and SMA 200 15-minutes among other indicators. There will also be some struggle at the weak-medium resistances highlighted at $8,974 and $9,066. A break above the coveted $9,000 level would have to be strong enough to overcome the selling pressure at $9250 if gains towards $10,000 are to come into the picture.

On the flip side, the most significant support lies at $8,698. This buyer congestion zone is highlighted by several technical indicators including the pivot point one-week support one, the Fibonacci 23.6% one-month, and the previous low one-day. Other subtle support areas include $8,606, $8,239 and $8,055.

fxsoriginal


Information on these pages contains forward-looking statements that involve risks and uncertainties. Markets and instruments profiled on this page are for informational purposes only and should not in any way come across as a recommendation to buy or sell in these assets. You should do your own thorough research before making any investment decisions. FXStreet does not in any way guarantee that this information is free from mistakes, errors, or material misstatements. It also does not guarantee that this information is of a timely nature. Investing in Open Markets involves a great deal of risk, including the loss of all or a portion of your investment, as well as emotional distress. All risks, losses and costs associated with investing, including total loss of principal, are your responsibility. The views and opinions expressed in this article are those of the authors and do not necessarily reflect the official policy or position of FXStreet nor its advertisers. The author will not be held responsible for information that is found at the end of links posted on this page.

If not otherwise explicitly mentioned in the body of the article, at the time of writing, the author has no position in any stock mentioned in this article and no business relationship with any company mentioned. The author has not received compensation for writing this article, other than from FXStreet.

FXStreet and the author do not provide personalized recommendations. The author makes no representations as to the accuracy, completeness, or suitability of this information. FXStreet and the author will not be liable for any errors, omissions or any losses, injuries or damages arising from this information and its display or use. Errors and omissions excepted.

The author and FXStreet are not registered investment advisors and nothing in this article is intended to be investment advice.

Join Telegram

Recommended content


Recommended Content

Editors’ Picks

Ethereum dips slightly amid Renzo depeg, BlackRock spot ETH ETF amendment

Ethereum dips slightly amid Renzo depeg, BlackRock spot ETH ETF amendment

Ethereum (ETH) suffered a brief decline on Wednesday afternoon despite increased accumulation from whales. This follows Ethereum restaking protocol Renzo restaked ETH (ezETH) crashing from its 1:1 peg with ETH and increased activities surrounding spot Ethereum ETFs.

More Ethereum News

Injective price weakness persists despite over 5.9 million INJ tokens burned

Injective price weakness persists despite over 5.9 million INJ tokens burned

Injective (INJ) price is trading with a bearish bias, stuck in the lower section of the market range. The bearish outlook abounds despite the network's deflationary efforts to pump the price. Coupled with broader market gloom, INJ token’s doomed days may not be over yet.

More Injective News

US intensifies battle against crypto privacy protocols following crackdown on Samourai Wallet

US intensifies battle against crypto privacy protocols following crackdown on Samourai Wallet

CEO Keonne Rodriguez and CTO William Lonergan of Samourai Wallet were arrested by the US Department of Justice (DoJ) on Wednesday and charged with $100 million in money laundering on a count and illegal money transmitting on another count. This move could see privacy-focused cryptocurrencies take a dip.

More Cryptocurrencies News

Near Protocol Price Prediction: NEAR fulfills targets but a 10% correction may be on the horizon

Near Protocol Price Prediction: NEAR fulfills targets but a 10% correction may be on the horizon

Near Protocol price has completed a 55% mean reversal from the bottom of the market range at $4.27. Amid growing bearish activity, NEAR could drop 10% to the $6.00 psychological level before a potential recovery. A break and close above $7.95 would invalidate the downleg thesis.

More Near Protocol News

Bitcoin: BTC post-halving rally could be partially priced in Premium

Bitcoin: BTC post-halving rally could be partially priced in

Bitcoin (BTC) price briefly slipped below the $60,000 level for the last three days, attracting buyers in this area as the fourth BTC halving is due in a few hours. Is the halving priced in for Bitcoin? Or will the pioneer crypto note more gains in the coming days? 

Read full analysis

BTC

ETH

XRP