Bitcoin price analysis: BTC/USD finds support at the SMA 200 curve
- The Moving Average Convergence/Divergence (MACD) indicates a reversal of bullish momentum.
- The SMA 20 crossed over the SMA 50 curve, which is a bullish sign.

The BTC/USD daily chart is trending in a narrow $400 range between $9,550 and $9,150. Bitcoin managed to chart two bearish days in a row. So far today, BTC/USD fell from $9,203 to $9,182. The hourly break of Thursday and Friday shows us that BTC/USD flew up to $9,146.45 before the bears took control of the market. Despite comeback attempts by bulls, the sellers took down the price to $9,172.40, where it found intraday support. Since then, the price has trended horizontally to finish around $9,182.
BTC/USD daily chart
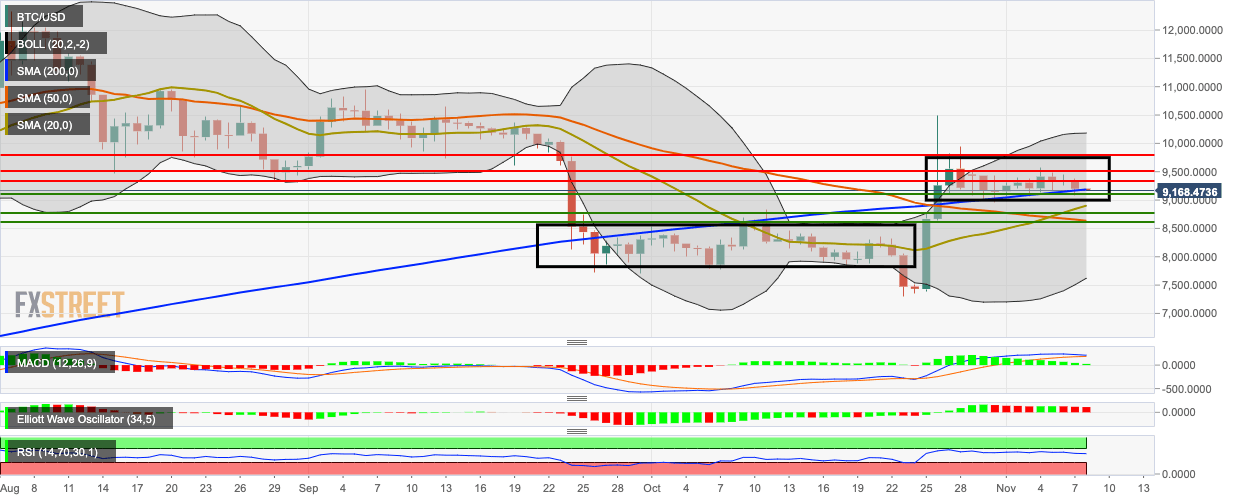
The 200-day Simple Moving Average (SMA 200) is acting as immediate support, holding the price up. The SMA 20 has crossed over the SMA 50 curve, which is a bullish sign. The Moving Average Convergence/Divergence (MACD) indicates a reversal of bullish momentum. The Elliott Oscillator has had three straight red sessions, while the Relative Strength Index is trending around 58.30.
Author

Rajarshi Mitra
Independent Analyst
Rajarshi entered the blockchain space in 2016. He is a blockchain researcher who has worked for Blockgeeks and has done research work for several ICOs. He gets regularly invited to give talks on the blockchain technology and cryptocurrencies.


