Bitcoin Price Analysis: BTC/USD erases Saturday's gains, returns to $11,000 area
- Bitcoin rose to its highest level since early September on Saturday.
- Bitcoin lost its traction before testing key Fibo level near $11,200.
- $10,800 aligs as the immediate support if downward correction continues.

Bitcoin (BTC/USD) rose to its highest level in more than two weeks at $11,800 on Saturday but failed to preserve its bullish momentum. As of writing, the pair was down 1% on a daily basis at $10.970.
Bitcoin technical outlook
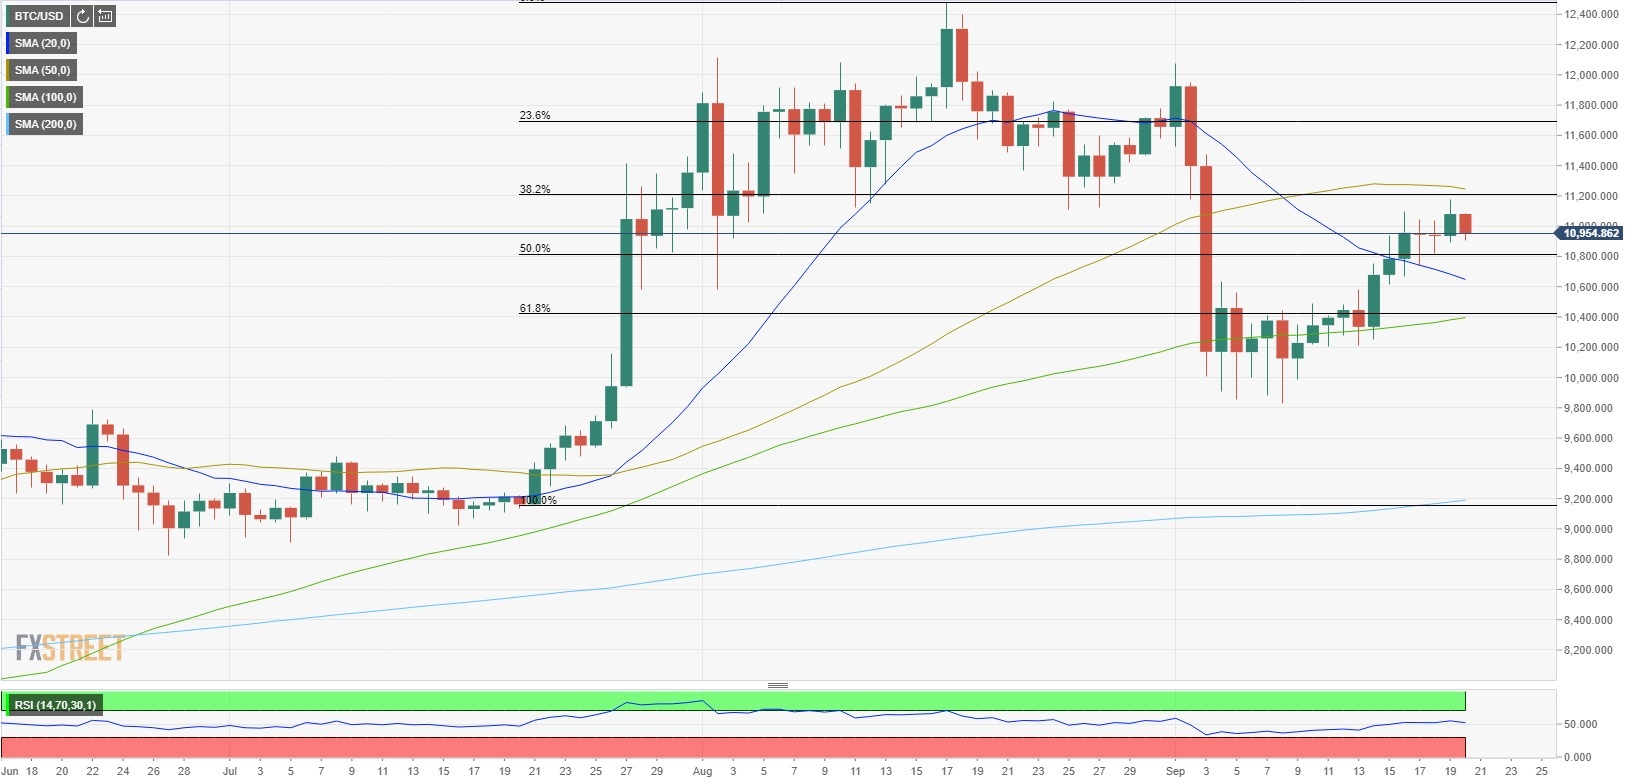
A tough resistance seems to have formed at $11,200 (Fibonacci 38.2% retracement of July 21-August 18 uptrend). If Bitcoin manages to climb above that level and make a daily closing there, it could target $11,700 (Fibonacci 23.6% retracement) ahead $12,000 (psychological level). Meanwhile, the Relative Strength Index (RSI) on the daily chart retreated to 50 area, suggesting that buyers are struggling to take control of the price action.
On the downside, the downward correction could extend to $10,800 (Fibonacci 50% retracement). Below that level, $10,400 (100-day SMA/Fibonacci 61.8% retracement) is the last line of defense ahead of $10,000 (psychological level).
Bitcoin chart (daily)
Author

Eren Sengezer
FXStreet
As an economist at heart, Eren Sengezer specializes in the assessment of the short-term and long-term impacts of macroeconomic data, central bank policies and political developments on financial assets.


