|

Bitcoin Price Analysis: BTC/USD closes in on $12,000 after Friday's consolidation

  • Bitcoin is posting modest daily gains on Saturday.
  • A weekly close above $12,000 could open the door for further gains.
  • Daily RSI stays a little below the overbought area.

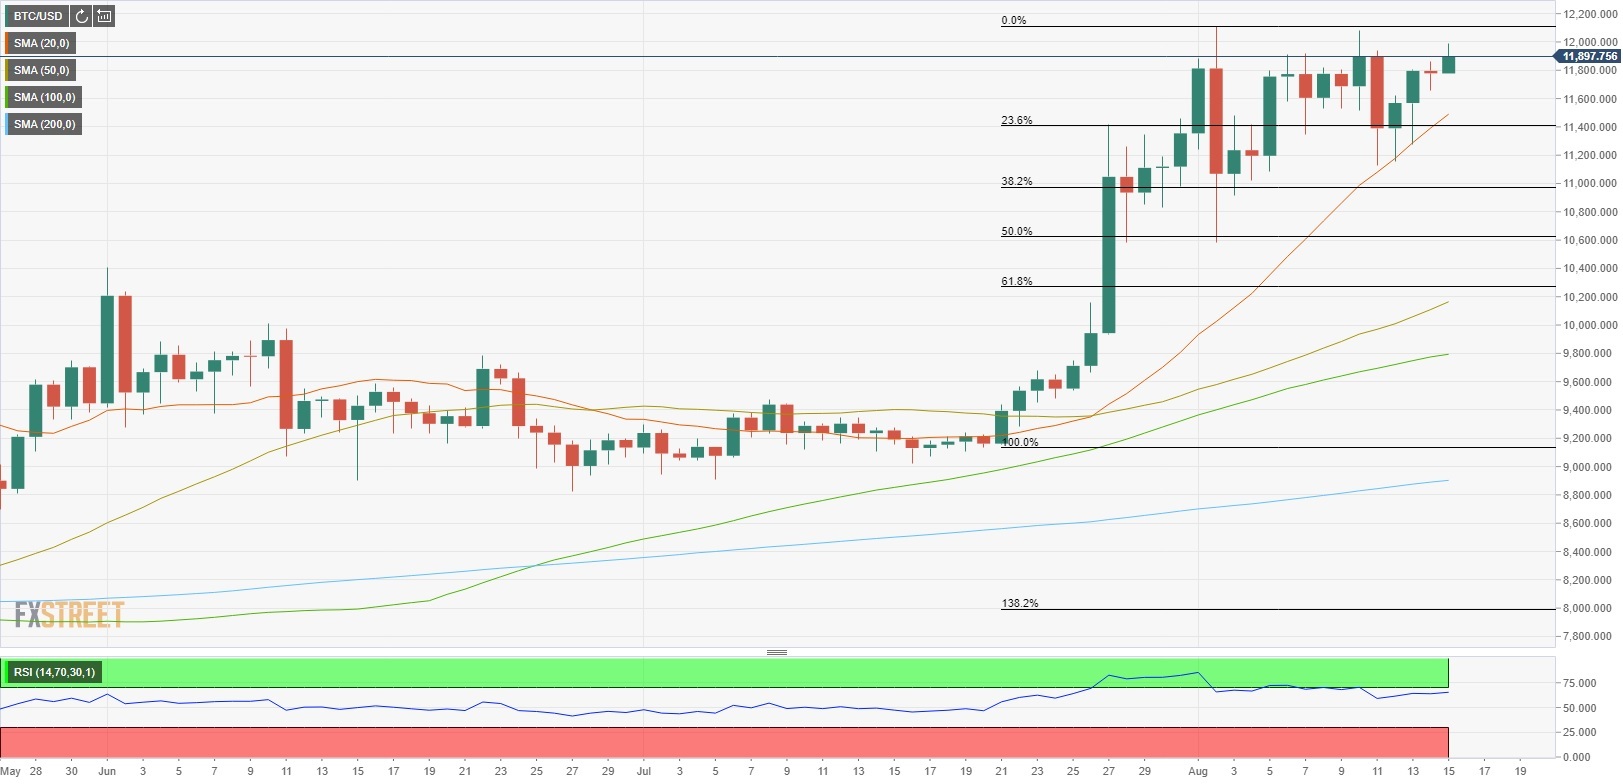
After climbing above $12,000 for the first time in nearly a year, Bitcoin (BTC/USD) formed a consolidation channel and has been fluctuating in that channel for the past two weeks. Following a drop to the lower range of that channel near $11,000, BTC/USD staged a rebound and is now, once again, approaching $12,000. As of writing, Bitcoin was up 1.35% on a daily basis at $11,940.

BTC/USD technical outlook

On the daily chart, the Relative Strength Index is staying within a touching distance of 70, suggesting that the pair is likely to become overbought when it reaches the 12-month high it set at $12,112 on August 2nd. However, if Bitcoin closes the week above $12,000, buyers could look to remain in control of the price action even if the pair stages a technical correction.

Above $12,100, $12,325 (August 6, 2019, high) aligns as the initial resistance ahead of $13,195 (July 10, 2019, high). On the downside, $11,500 (20-day SMA) is the first support before $11,000 (lower limit of two-week-old range, Fibonacci 23.6% retracement of July 24 - August 2 rally). 

Additional levels to watch for

BTC/USD

Overview
Today last price11901.43
Today Daily Change123.19
Today Daily Change %1.05
Today daily open11778.24
 
Trends
Daily SMA2011392.45
Daily SMA5010109.71
Daily SMA1009774.8
Daily SMA2008890.4
 
Levels
Previous Daily High11863.17
Previous Daily Low11654.35
Previous Weekly High12083.95
Previous Weekly Low11125.12
Previous Monthly High11457.43
Previous Monthly Low8907.52
Daily Fibonacci 38.2%11734.12
Daily Fibonacci 61.8%11783.4
Daily Pivot Point S111667.34
Daily Pivot Point S211556.44
Daily Pivot Point S311458.52
Daily Pivot Point R111876.16
Daily Pivot Point R211974.07
Daily Pivot Point R312084.97

BTC/USD daily chart

Author

Eren Sengezer

As an economist at heart, Eren Sengezer specializes in the assessment of the short-term and long-term impacts of macroeconomic data, central bank policies and political developments on financial assets.


More from Eren Sengezer
Share:

Editor's Picks

XRP slips near key support as geopolitical tensions re-escalate

Ripple (XRP) continues to trim gains on Wednesday, trading around $1.32 at the time of writing. The remittance token came under pressure after a massive 72% rally from $1.00 to $1.70 in August stalled on profit-taking and the need to moderate in search of fresh liquidity.

Crypto Today: Bitcoin, Ethereum, XRP edge lower as renewed US-Iran tensions weigh

The cryptocurrency market is pulling back broadly on Wednesday as investors adopt a cautious stance, with Bitcoin consolidating near its short-term support at $77,000. Ethereum remains under pressure, slipping toward $2,400. Ripple is also trending lower.

Bitcoin faces pressure as ETF outflows, Fed rate-hike bets weigh

Bitcoin remains under pressure, trading around $77,600 on Wednesday after slipping 1.45% the previous day. Rising energy prices amid fresh US-Iran tensions alongside growing expectations for Fed interest rate hikes could weigh on BTC.

Shiba Inu Price Forecast: Faces downside risks as whale selling rises

Shiba Inu (SHIB) trades around $0.00000516 on Wednesday following a rebound of nearly 4% earlier this week. Despite the price recovery, Santiment data shows certain whales offloading SHIB tokens.

Bitcoin: Billions in ETF inflows push BTC toward decisive breakout
Bitcoin (BTC) extends gains so far this week, trading near $80,000 after testing the 50-week Simple Moving Average (SMA) at $81,114 earlier. Strong institutional demand is supporting the rally, with spot BTC Exchange Traded Funds (ETFs) on track to record a second consecutive week of billion-dollar inflows.