|

Bitcoin Price Analysis: BTC charts triangle breakdown as correction from record highs gathers steam

  • BTC/USD threatens 100-HMA after correcting sharply from $34,800.
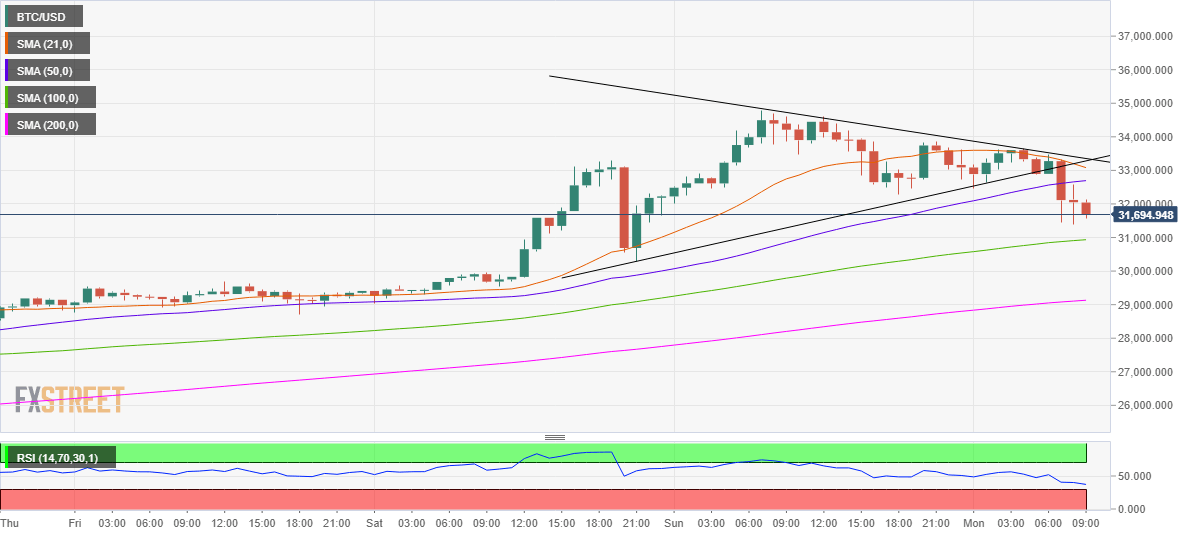
  • A symmetrical triangle breakdown spotted on the hourly chart.  
  • Dip buying could be seen again in Bitcoin so long as $30K holds.  

Bitcoin (BTC/USD) is looking to crack the $30K level, as the retracement from all-time-highs picks up pace in the first full trading week of 2021.

The no. 1 coin extended its recent rally and recorded fresh parabolic highs at 34,799 on Sunday, having surged by over 300% in 2020. The sellers stepped in thereafter, knocking off the prices by almost $3400.
BTC/USD: Hourly chart

Looking from a technical perspective, the most favorite digital asset is set to extend the corrective pullback, as it has confirmed a symmetrical triangle breakdown on the hourly chart.

The price continued to face rejection at the critical 21-hourly moving average, now at $33,088, prompting the bears to regain control.

At the moment, the bears are taking a breather before the next push lower. Immediate support awaits at the 100-HMA of $30,935.

Further south, the critical $30K level will challenge the bears’ commitment, below which the upward-sloping 200-HMA support at $29,131 could be tested.

Markets could witness dip-buying opportunities so long as the bulls manage to defend the $30K threshold.

Any pullbacks could meet strong supply at the bullish 50-HMA hurdle at $32,695. Acceptance above the latter could bring the 21-HMA resistance back in play.  

The hourly Relative Strength Index (RSI) points south, holding well above the oversold territory, suggesting that there is room for a deeper correction.  

Bitcoin: Additional levels

BTC/USD

Overview
Today last price31684.22
Today Daily Change-1405.09
Today Daily Change %-4.25
Today daily open33089.31
 
Trends
Daily SMA2025602.35
Daily SMA5021287.94
Daily SMA10016991.18
Daily SMA20013720.34
 
Levels
Previous Daily High34799.39
Previous Daily Low32001.04
Previous Weekly High29683.91
Previous Weekly Low25771.59
Previous Monthly High29307.4
Previous Monthly Low17578.63
Daily Fibonacci 38.2%33730.42
Daily Fibonacci 61.8%33070.01
Daily Pivot Point S131793.77
Daily Pivot Point S230498.23
Daily Pivot Point S328995.42
Daily Pivot Point R134592.12
Daily Pivot Point R236094.94
Daily Pivot Point R337390.48

Author

Dhwani Mehta

Dhwani Mehta

FXStreet

Residing in Mumbai (India), Dhwani is a Senior Analyst and Manager of the Asian session at FXStreet. She has over 10 years of experience in analyzing and covering the global financial markets, with specialization in Forex and commodities markets.


More from Dhwani Mehta
Share:

Editor's Picks

Zcash rally hits record high in a parallel channel amid network growth

Zcash rally continues to scale higher, trading above $1,600 on Wednesday after a 10% jump the previous day. The privacy-focused token witnesses a surge in shielded activity, recording the highest weekly total since 2022, while Grayscale’s ZEC-focused fund logged over $30 million in inflows on Tuesday.

Bitcoin Cash, BitcoinSV, and LayerZero rallies push higher

Top altcoins, including Bitcoin Cash, BitcoinSV, and LayerZero, are up in double digits over the last 24 hours, suggesting a potentially stable upward trend. BCH reclaims the $300 threshold, scaling to a three-month high while BSV and ZRO are trading at their annual and four-month highs, respectively.

Bitcoin steadies after strong rally, Ethereum and XRP ease into consolidation

Bitcoin, Ethereum, and Ripple bulls take a breather mid-week after gains of 6%, 4%, and 13% so far this week. BTC consolidates at $86,300, ETH hovers around $2,751, and XRP is at $1.57. The price action of these top three cryptocurrencies suggests bulls remain in control.

Ethereum holds above $2,700 as investors continue bullish positioning

Ethereum held above $2,700 on Tuesday after starting the week on a positive note. The top crypto stretched its 7-day gains to 14% after energy prices and the US 10-year Treasury yields dipped on Monday.

Bitcoin: BTC shrugs off CLARITY Act setback and hawkish Fed
Bitcoin (BTC) price action has remained resilient this week, trading above $78,000 at the time of writing on Friday, heading toward a key resistance zone. Institutional demand shows early signs of weakness, with spot Exchange Traded Funds (ETFs) on track for a second straight week of outflows, with over $420 million recorded through Thursday amid escalating Middle East tensions.