|

Bitcoin Price Analysis: BTC bulls regain control, $11,800 back in sight

  • Bitcoin defies Saturday’s bearish odds, as the journey towards $11,800 resumes.
  • A potential bull flag spotted on the 15-minutes chart.
  • BTC/USD trades above all major SMAs in the given timeframe.

After Saturday’s temporary pullback, Bitcoin (BTC/USD) has resumed its recovery momentum from Thursday’s sell-off to $11,125. The widely-traded crypto coin finally surpassed the $11,600 barrier, as the bulls remain in control near six-day highs this Sunday. Bitcoin gains 1.20% to trade around 11,600, as we write. The market capitalization of the No.1 digital asset increased to $214.64 billion vs. Saturday’s $212.57 billion.

Technical Overview

BTC/USD: 15-minutes chart
fxsoriginal

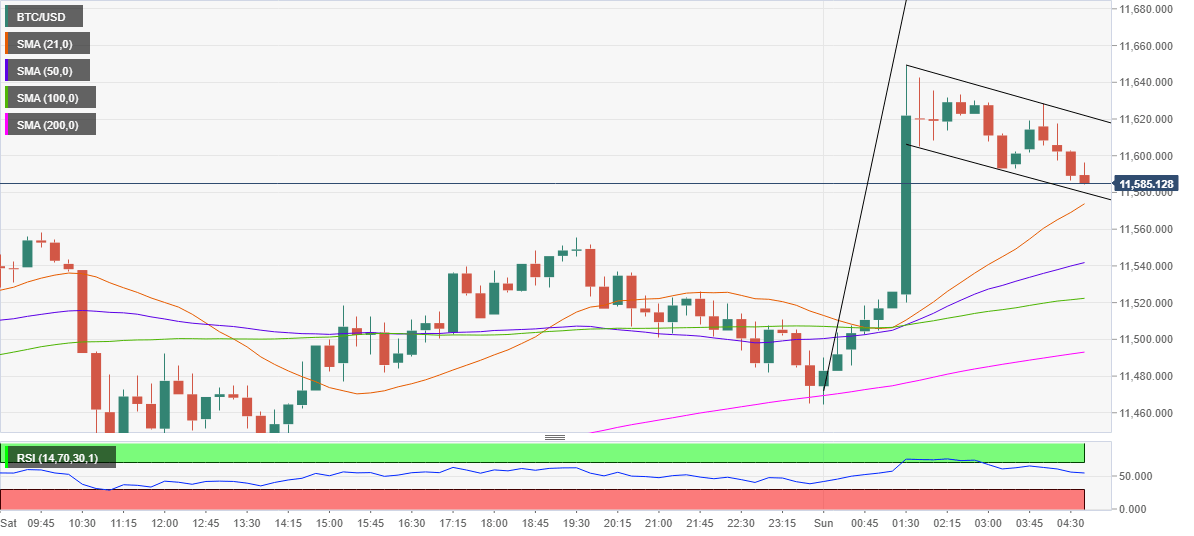
BTC/USD held onto the robust support at $11,420 and from there it staged a solid comeback on Saturday. In early Sunday, the rebound received fresh legs after the price witnessed a $130 spike to six-day highs of $11,649 in a matter of 15 minutes.

The latest rally and the following consolidation have carved out a bull flag formation on the 15-minutes chart. It’s usually a bullish continuation pattern.

Therefore, a break above the falling trendline resistance at 11,624 would validate the pattern, calling for a test of the target at $11,809.

Ahead of the pattern target, the bulls will face stiff resistance at $11,768, August 25 high.

On the flip side, a breach of the falling trendline support at $11,581 could prompt a reversal towards the immediate downside target at $11,569, which is the 21-Simple Moving Average (SMA).

The next supports await at the bullish 50-SMA and 100-SMA, now placed at $11,541 and $11,522 respectively.

Further south, the upward-sloping 200-SMA at $11,493 could challenge the bears’ commitment.

To conclude, the upside appears more compelling amid the bullish technical set up, especially with the Relative Strength Index (RSI) trading above the 50 level. Additionally, the coin trades above all the major SMAs on the given timeframe, backing the bullish case.

BTC/USD: Additional levels to watch

BTC/USD

Overview
Today last price11589.06
Today Daily Change114.40
Today Daily Change %1.00
Today daily open11474.66
 
Trends
Daily SMA2011691.18
Daily SMA5010862.2
Daily SMA10010118.38
Daily SMA2009047.22
 
Levels
Previous Daily High11583.71
Previous Daily Low11423.79
Previous Weekly High11824.83
Previous Weekly Low11113.43
Previous Monthly High11457.43
Previous Monthly Low8907.52
Daily Fibonacci 38.2%11484.88
Daily Fibonacci 61.8%11522.62
Daily Pivot Point S111404.39
Daily Pivot Point S211334.13
Daily Pivot Point S311244.48
Daily Pivot Point R111564.31
Daily Pivot Point R211653.97
Daily Pivot Point R311724.23

Author

Dhwani Mehta

Dhwani Mehta

FXStreet

Residing in Mumbai (India), Dhwani is a Senior Analyst and Manager of the Asian session at FXStreet. She has over 10 years of experience in analyzing and covering the global financial markets, with specialization in Forex and commodities markets.


More from Dhwani Mehta
Share:

Editor's Picks

Ripple slips as liquidity improves, ETF inflows return

Ripple (XRP) is losing strength, trading below $1.40 on Tuesday. Although minor, the correction comes after a sharp move toward $1.50 the previous day and aligns with a lethargic outlook in the broader crypto market.

Top Altcoins Price Forecast: Ripple, Cardano, Hyperliquid – Easing bullish momentum sparks downside risks

Top altcoins, including Ripple, Cardano, and Hyperliquid, are trading in the red on Tuesday, with roughly 2% losses so far. The altcoins are facing downside pressure ahead of the CLARITY Act cloture vote scheduled for Tuesday.

Crypto Today: Bitcoin, Ethereum and XRP stall ahead of key CLARITY Act vote

Cryptocurrency prices are under pressure on Tuesday, with Bitcoin retreating below $77,000. This pullback comes on the heels of last week's failed breakout and is echoed across major altcoins, as Ethereum and Ripple both slip below key psychological levels at $2,500 and $1.40, respectively.

Bitcoin remains range-bound as liquidation risks build

Bitcoin faces mild pressure, trading below $77,000 at the time of writing on Tuesday following a recovery the previous day. Institutional demand shows early signs of return with spot Exchange Traded Funds recording an inflow on Monday, snapping a four-day outflow streak.

Bitcoin: BTC retreats as macro headwinds grow
Bitcoin (BTC) remains under pressure, down over 4% this week and trading around $76,900 at the time of writing on Friday. Institutional demand shows signs of weakness as spot BTC Exchange Traded Funds (ETFs) are on track to end their three-week inflow streak, recording nearly $500 million in net outflows through Thursday.


