Bitcoin Price Analysis: Bitcoin goes into consolidation near $9,100 after Friday's rebound
- Bitcoin continues to trade in tight channel above $9,000.
- Descending triangle on daily chart points out to bearish continuation.

Bitcoin (BTC/USD) came under pressure mid-week following the Twitter scam and dropped to a 10-day low of $9,000 on Thursday. However, BTC/USD staged a technical rebound and close in the positive territory at $9,150 on Friday. Nevertheless, the pair seems to be having a difficult time building on Friday's gains and was last seen losing 0.25% on the day at $9,131.
BTC/USD technical outlook
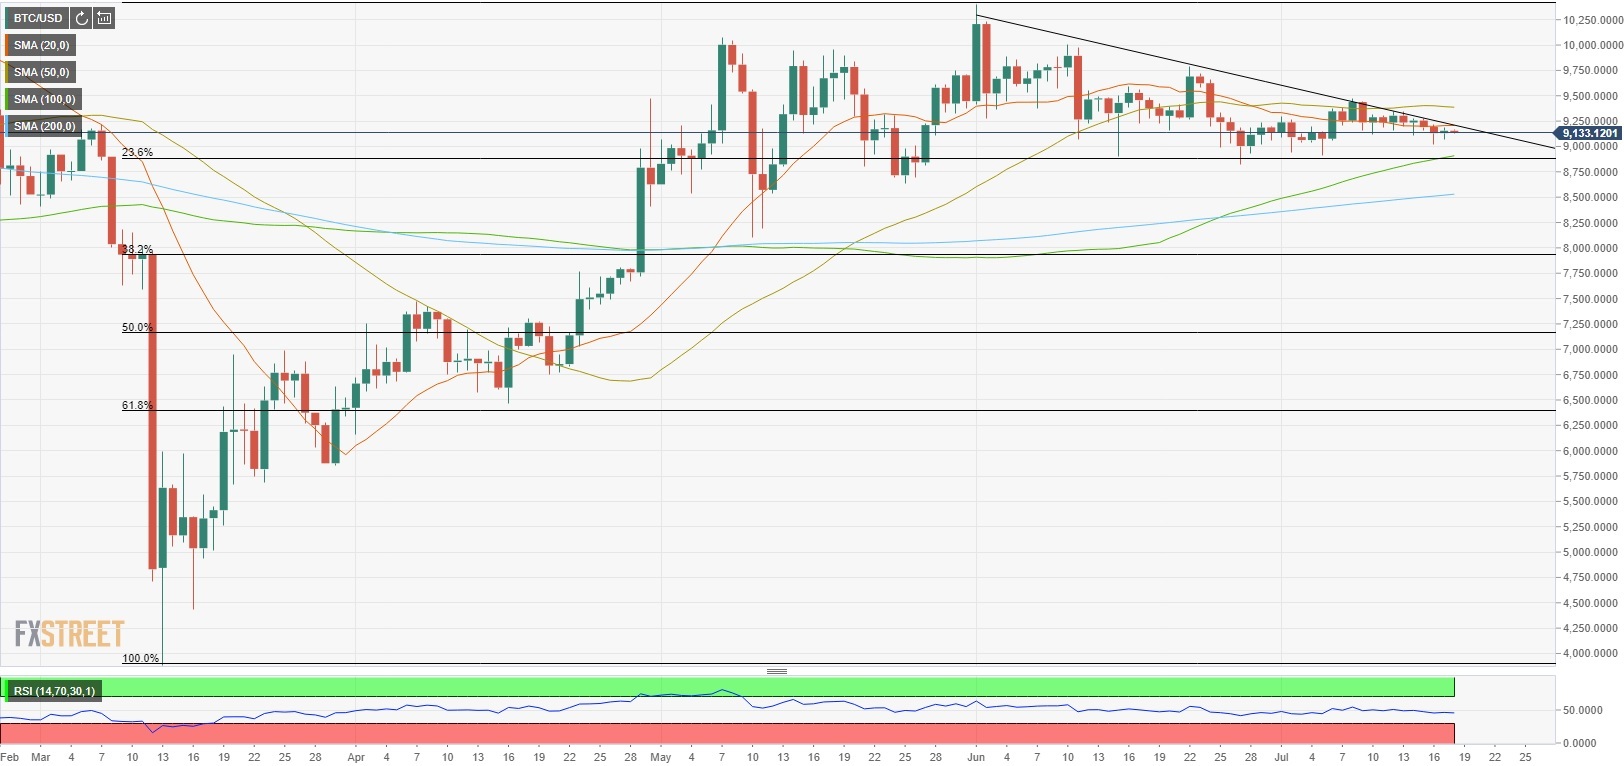
Despite the heightened volatility earlier in the week, Bitcoin's near-term outlook remains neutral with the daily Relative Strength Index moving sideways near 50.
On the downside, strong support seems to have formed in $9,000/$8,750 region (Jul. 16 low/100-day SMA/Jul. 5 low/Fibonacci 23.6% retracement of March-June rally). This area also coincides with the tip of the descending triangle that started to form around mid-June. If the price continues to follow that bearish continuation pattern, we could see BTC/USD break out of it toward the end of the month. In case that happens, $8,500 (200-day SMA) could be the next target.
Resistance align at $9,200 (20-day SMA), $9,400 (50-day SMA) and $9,780 (Jun. 22 high).
BTC/USD chart (daily)
Author

Eren Sengezer
FXStreet
As an economist at heart, Eren Sengezer specializes in the assessment of the short-term and long-term impacts of macroeconomic data, central bank policies and political developments on financial assets.


