|

Bitcoin Price Analysis: Bearish bias still intact while below 200-HMA

  • BTC buyers appear struggling on the road to recovery.  
  • Technical set up still remains in favor of the bears in the near-term.
  • BTC/USD breached 10k for the first in four days in a wild Saturday trading.

Bitcoin (BTC/USD), the most favorite cryptocurrency, witnessed a volatile Saturday and slipped below the 10k mark for the first time in four days. The spot saw some aggressive selling after the bulls failed to defend the key support around 10,080 (as well predicted here), exposing the 9,700 level. On Sunday, the BTC buyers seem to have returned, as they strive to extend the recovery mode beyond the 10k level. At the time of writing, Bitcoin battles 10k, gaining 1% on the day while down nearly 2.75% over the last 24 hours. Its market capitalization now stands at $182.06 billion, down from $186.27 billion seen before the late-Saturday slump.

Technical Overview

BTC/USD hourly chart


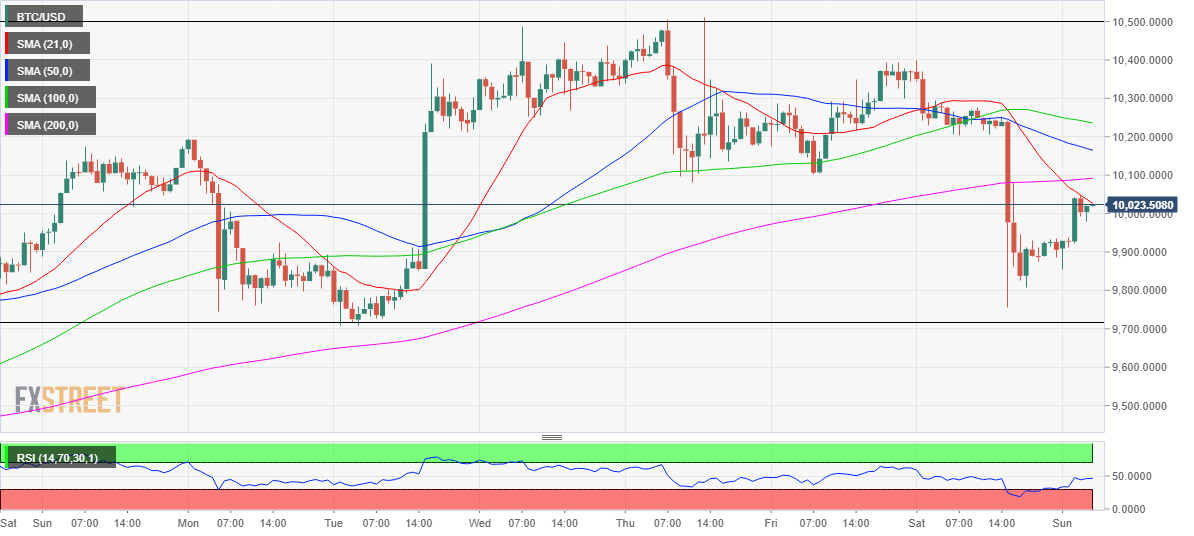
From a technical perspective, the corrective slide in the No. 1 coin accelerated only after the 21-hourly Simple Moving Average (SMA), now at 10,035, pierced both 50 and 100-HMAs from above. The spot saw a fresh leg lower and subsequently reached a new four-day low at 9,755.78 after the bulls caved into the 200-HMA support near 10,080. At the same time, the hourly Relative Strength Index (RSI) extended its south-run and entered the oversold territory.

As for Sunday’s trading so far, the bearish 21-HMA continues to cap the recovery attempts while the hourly RSI remains below the mid-line. Only a sustained break above the latter would offer some fresh signs of life to the BTC bulls. But the key horizontal 200-HMA support-turned-resistance, now at 10,090 needs to be taken out for a move back towards the 10,200 level. In the near-term, the bearish bias still remains intact as long as the price trades below the 200-HMA and therefore, a re-test of the 9,700 mark (key horizontal trendline support) cannot be ruled out.

BTC/USD key levels to watch

BTC/USD

Overview
Today last price10011.02
Today Daily Change114.14
Today Daily Change %1.15
Today daily open9905.69
 
Trends
Daily SMA209689.31
Daily SMA508717.59
Daily SMA1008171.82
Daily SMA2008881.66
 
Levels
Previous Daily High10399.45
Previous Daily Low9755.78
Previous Weekly High10511.86
Previous Weekly Low9707.96
Previous Monthly High9568.13
Previous Monthly Low6856.63
Daily Fibonacci 38.2%10001.66
Daily Fibonacci 61.8%10153.57
Daily Pivot Point S19641.17
Daily Pivot Point S29376.64
Daily Pivot Point S38997.5
Daily Pivot Point R110284.84
Daily Pivot Point R210663.98
Daily Pivot Point R310928.51

Author

Dhwani Mehta

Dhwani Mehta

FXStreet

Residing in Mumbai (India), Dhwani is a Senior Analyst and Manager of the Asian session at FXStreet. She has over 10 years of experience in analyzing and covering the global financial markets, with specialization in Forex and commodities markets.

More from Dhwani Mehta
Share:

Editor's Picks

Crypto Overview: Bitcoin stabilizes above $65,000, as Zcash and Worldcoin lead broader recovery

Bitcoin shows signs of recovery, trading above $65,000 on Monday, as the broader crypto market rebounds, fueled by improving sentiment following the United States (US) and Iran's confirmation of a preliminary peace agreement.

Crypto Today: Bitcoin, Ethereum, XRP recovery gathers strength as US-Iran reach peace agreement

Cryptocurrency prices remain broadly elevated on Monday, led by Bitcoin’s upswing toward $66,000. Altcoins, including Ethereum and Ripple, mirror Bitcoin’s momentum, trading above $1,700 and $1.18.

Bitcoin extends rebound as US and Iran reach framework deal to end the war

Bitcoin steadies above $65,700 at the time of writing on Monday, after recovering nearly 4% in the previous week. BTC recovery was boosted following Sunday’s news that the US and Iran have reached a preliminary peace deal, lifting the risk appetite.

Pi Network Price Forecast: Launchpad upgrades, fading bearish pressure lift recovery prospects

Pi Network (PI) began the week on a positive note, trading above $0.1340 on Monday after posting a mild recovery and closing above a key resistance in the previous week.

Experts agree: Bitcoin nears bottom, but weak demand raises doubts
Bitcoin (BTC) is trading above $63,000 at the time of writing on Friday after rebounding from the key 200-week Simple Moving Average (SMA) near $62,000, a level widely viewed as key long-term support. The recovery may suggest that Bitcoin has found a floor after a sharp correction that spanned more than a month, but some warning signs persist.