Bitcoin might get boring – But Ether may propel LINK, UNI, ARB prices higher

The approval of spot Ether exchange-traded funds (ETFs) on May 23 by the United States Securities and Exchange Commission (SEC) failed to extend the rally in Ether, which rallied roughly 25% last week. A positive sign is that the regulatory approval did not start a sell-off, signaling that the ETH bulls are not rushing to the exit. This suggests that the traders seem to be in a wait-and-watch mode.
Meanwhile, Bitcoin (BTC $68,538) rallied near $72,000 this week, but the bulls could not sustain the higher levels. The price turned down and slipped below the psychological level of $70,000, indicating that the sideways price action may continue.
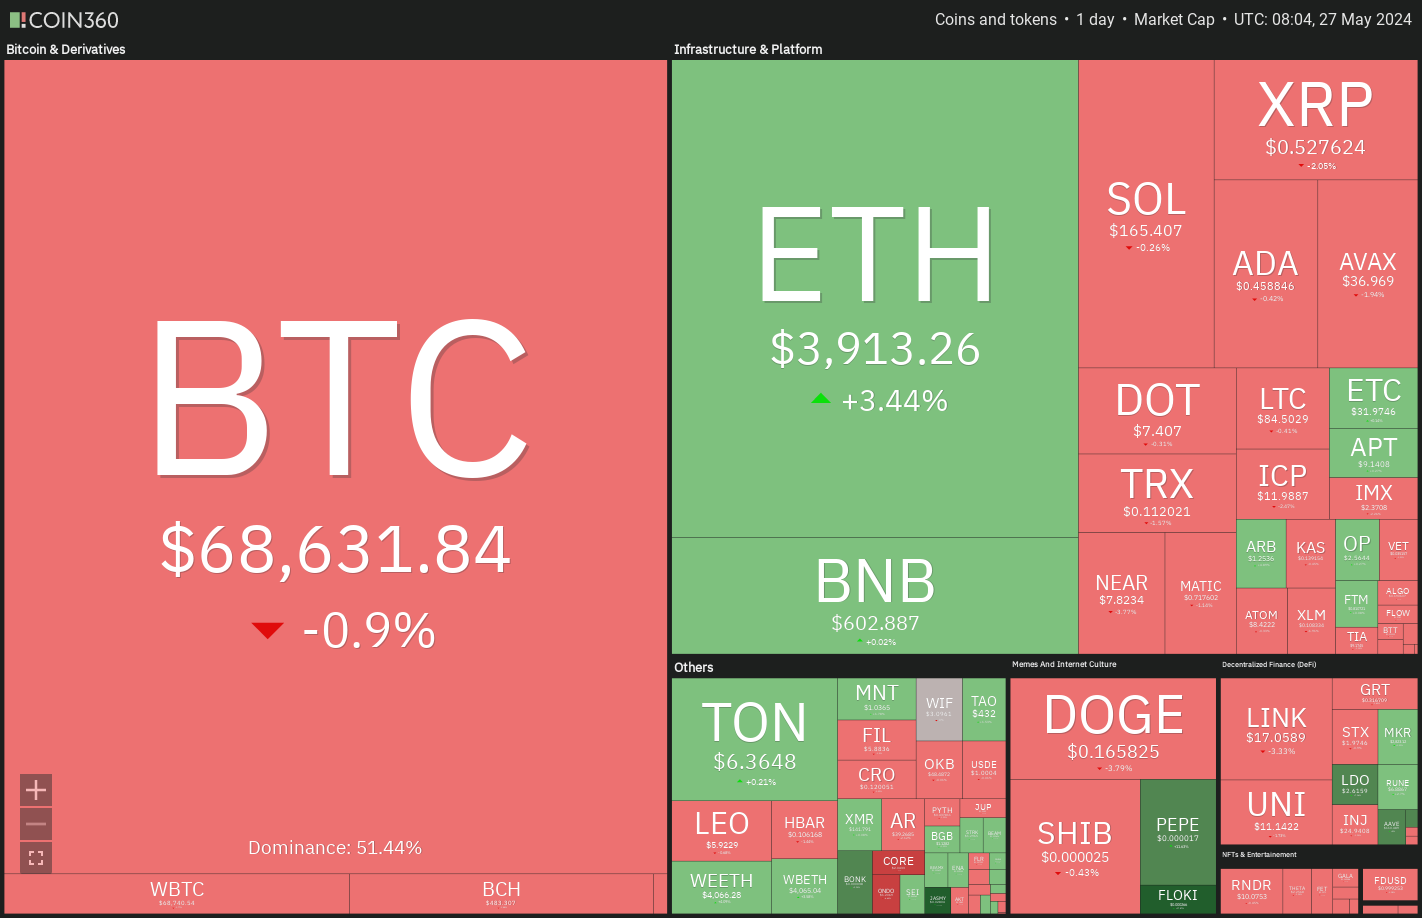
Crypto market data daily view. Source: Coin360
The positive movement in Bitcoin and Ether this week has triggered buying in select altcoins that are showing promise in the near term. If markets respect the support levels in Bitcoin and Ether, some altcoins could find buying support.
Do the technicals support a further rally in Bitcoin and Ether? Will buyers return to select altcoins? Let’s study the top-five cryptocurrencies that look promising on the charts.
Bitcoin price analysis
Bitcoin bounced off the 20-day exponential moving average ($66,814) on May 24, indicating that the sentiment has turned positive, and traders are buying on dips.
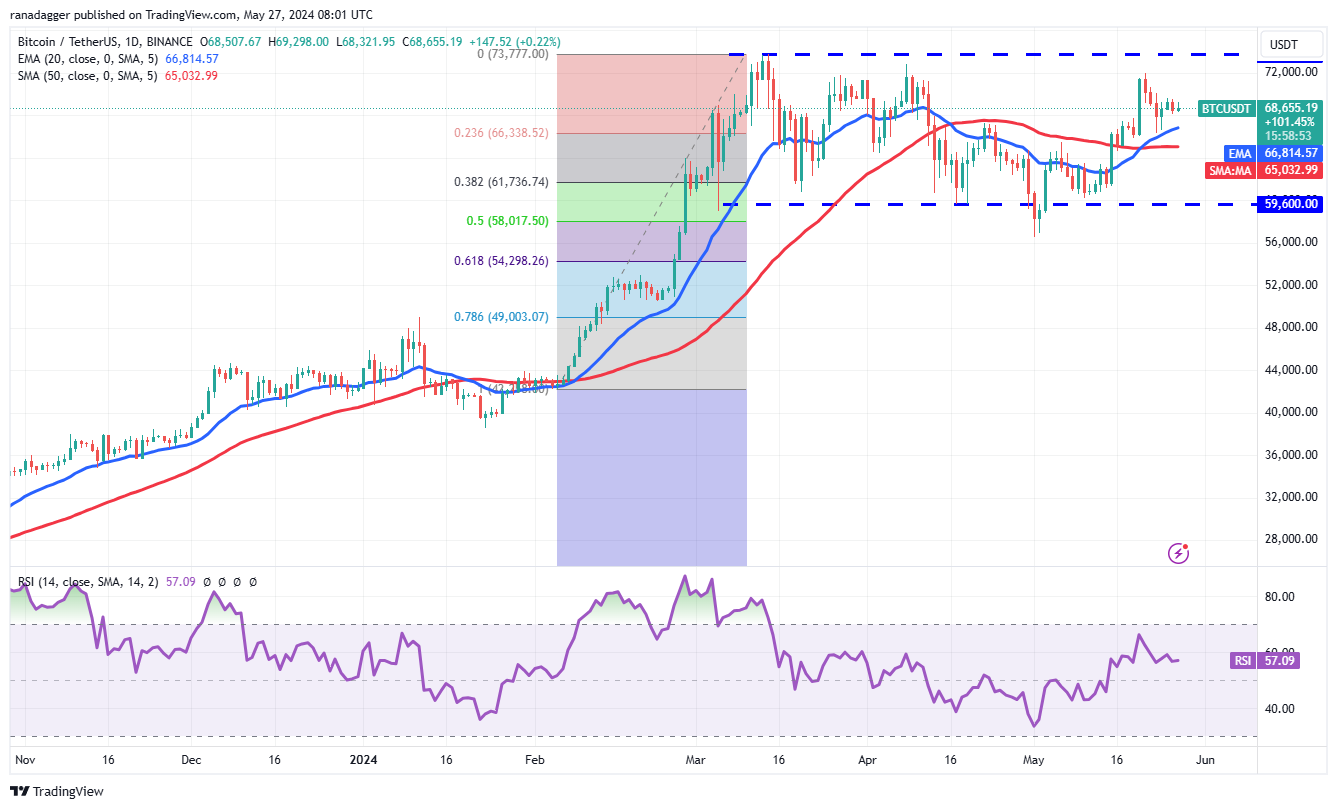
BTC/USDT daily chart. Source: TradingView
The bulls will attempt to push the price to the overhead resistance of $73,777. This is an important level to watch out for because the bears are expected to defend it vigorously. If the price turns down sharply from $73,777 and plummets below the moving averages, it will signal that the range-bound action may continue for some more time.
On the other hand, if bulls do not give up much ground from $73,777, it will improve the prospects of a breakout. The BTC/USDT pair could attempt a rally to $80,000 and then to $84,000.
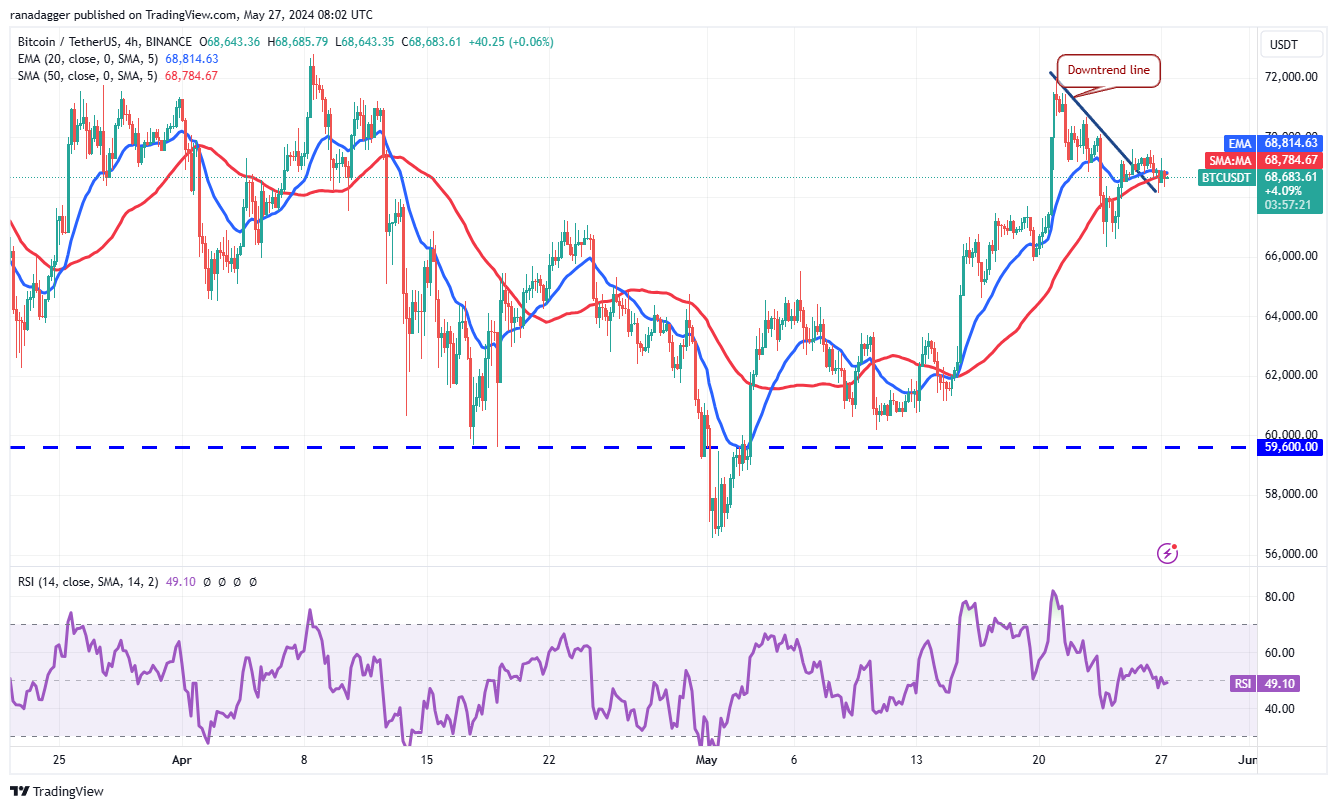
BTC/USDT 4-hour chart. Source: TradingView
Buyers pushed the price above the downtrend line but are struggling to sustain the higher levels. This suggests that the bears have not given up and are selling on rallies. If the price skids below the downtrend line, it could start a decline to $66,000 and then to $64,600.
If bulls want to retain the advantage, they will have to start a bounce off the moving averages and drive the price above $70,000. If they do that, the pair could rise to $72,000 and later to $73,777.
Ether price analysis
Ether (ETH $3,904) soared above $3,730 on May 21, and the bulls have maintained the price above the breakout level since then. This shows that the bulls are trying to flip the $3,730 level into support.
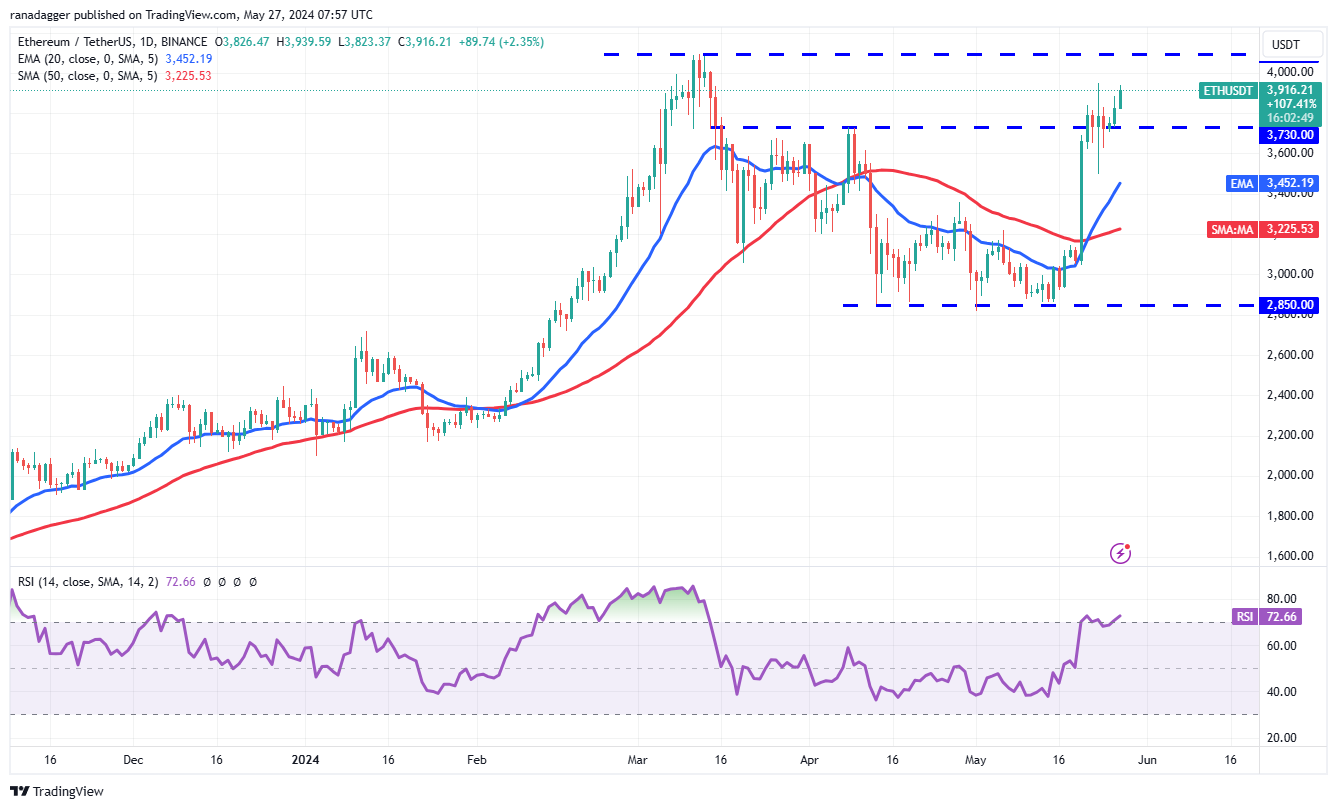
ETH/USDT daily chart. Source: TradingView
The 20-day EMA ($3,452) has started to turn up, and the RSI is in the overbought territory, signaling that the path of least resistance is to the upside. Buyers will try to push the price to the $3,950 to $4,100 zone. Sellers are expected to defend this zone with all their might because if the bulls prevail, the ETH/USDT pair could skyrocket toward $4,868.
Alternatively, if the bears sink the price below $3,730, it will suggest the start of a correction. The pair may drop to the 20-day EMA, which may serve as a strong support level. If the price rebounds off the 20-day EMA, the bulls will make one more attempt to resume the uptrend.
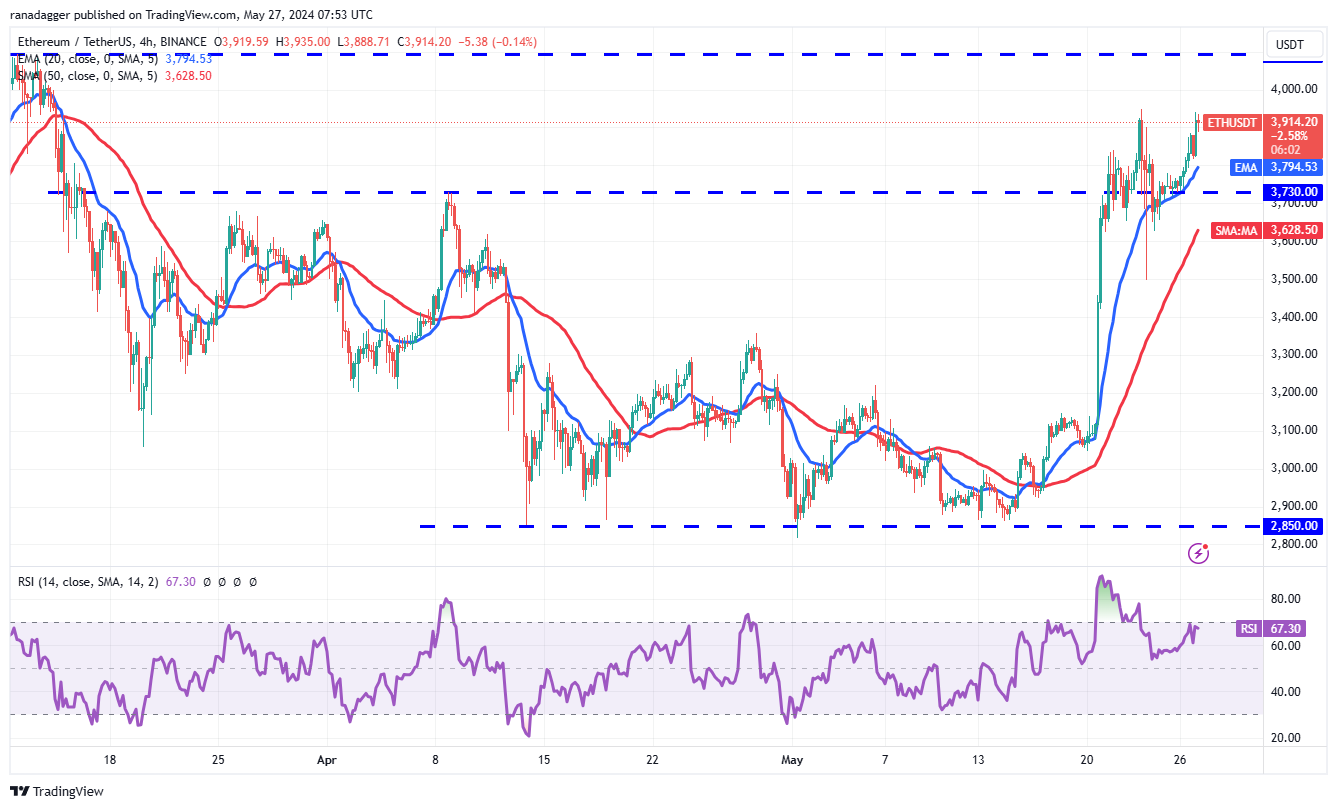
ETH/USDT 4-hour chart. Source: TradingView
The 4-hour chart shows that the moving averages are sloping up, and the RSI is near the overbought zone, signaling that bulls have the edge. Buyers will try to strengthen their position further by pushing the price above $3,950. If they succeed, the pair may climb to $4,100.
The bears are likely to have other plans. They will try to pull the price below the 20-EMA. If they do that, it could attract profit booking by the short-term bulls. The pair may drop to $3,730 and thereafter to the 50-SMA. A break below this level will tilt the advantage in favor of the sellers.
Chainlink price analysis
Chainlink (LINK $17.16 ) has been trading near the critical overhead resistance level of $17.32 for the past three days, indicating a tussle between the bulls and the bears.
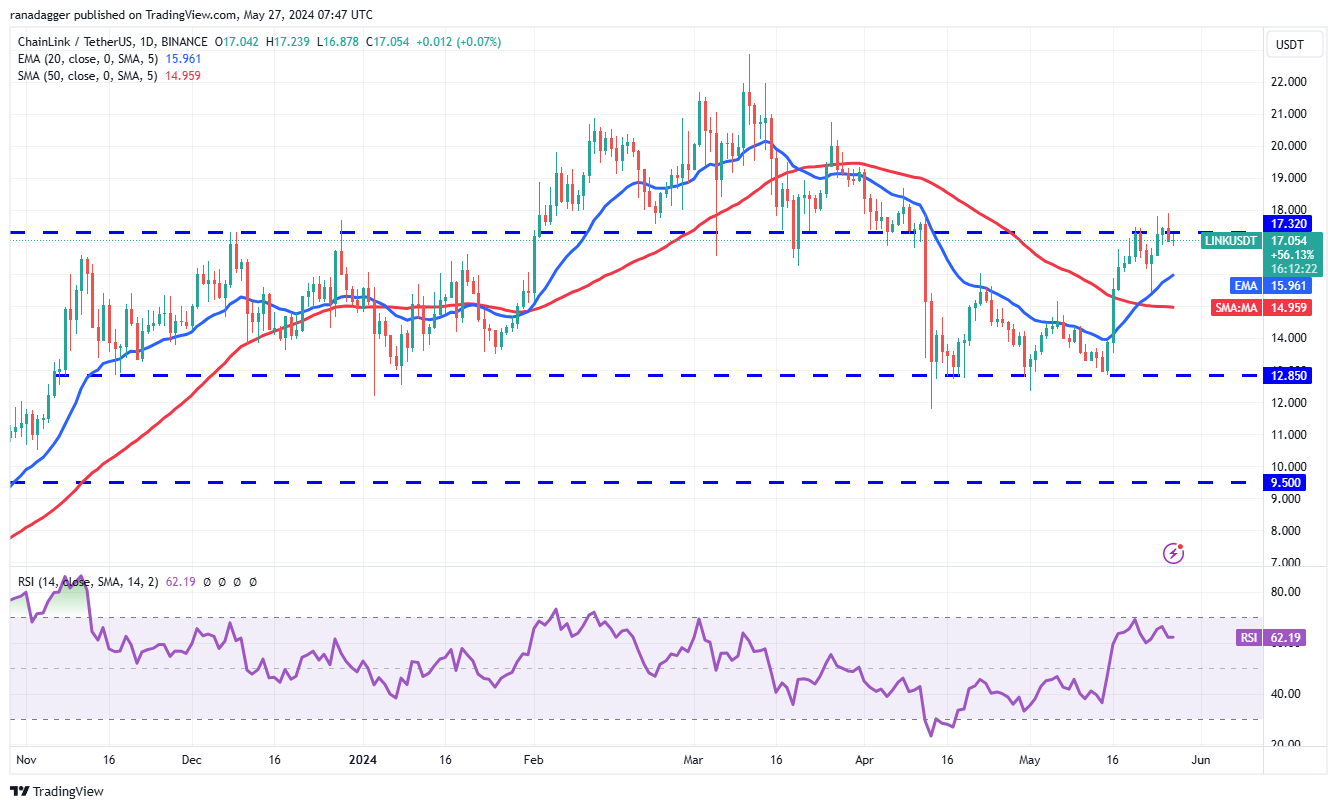
LINK/USDT daily chart. Source: TradingView
The upsloping 20-day EMA ($15.96) and the RSI above 62 suggest that the bulls are in command. There is a minor resistance at $18.68, but if bulls clear this hurdle, the LINK/USDT pair could travel to $20.74 and subsequently to $22.
Contrary to this assumption, if the price turns down and sustains below $17.32, it will indicate that the markets have rejected the breakout. The pair may slump to the 20-day EMA and then to the 50-day SMA ($14.95).
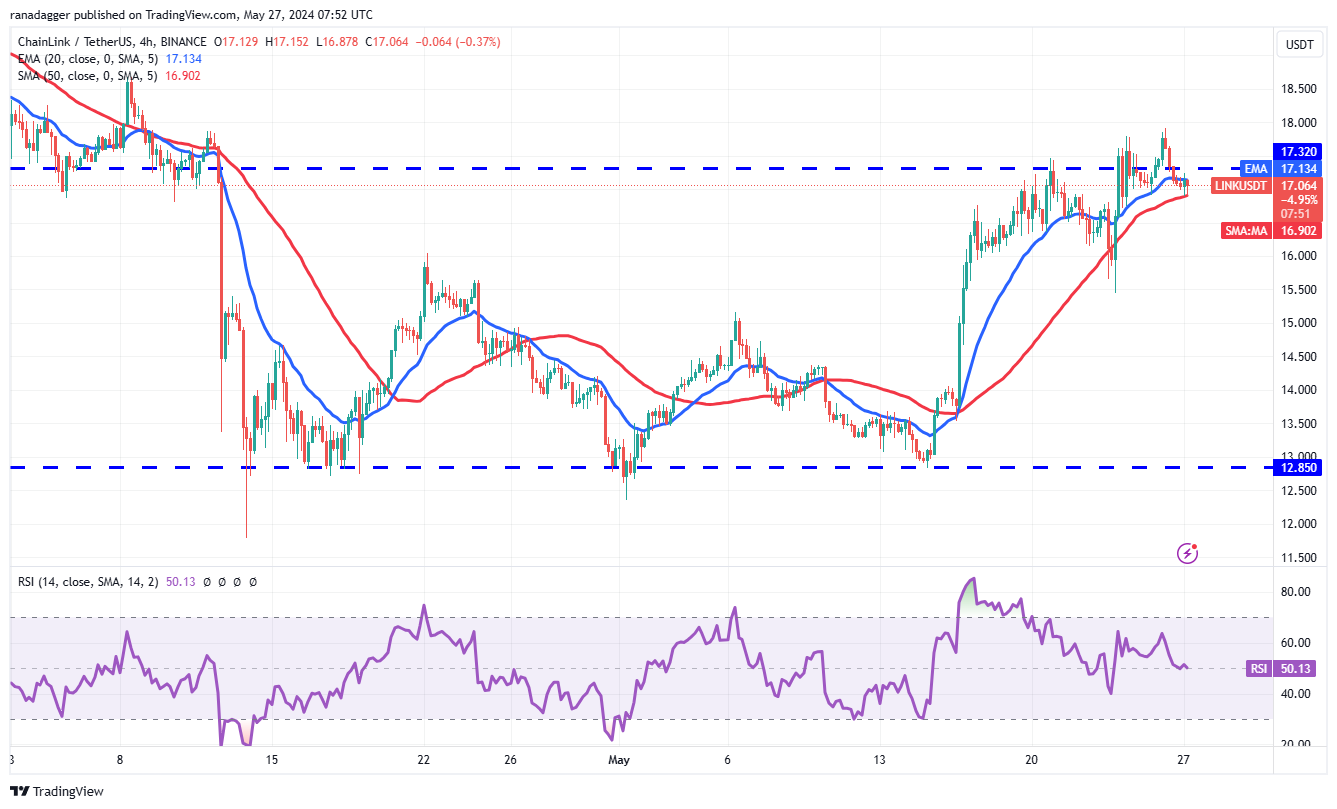
LINK/USDT 4-hour chart. Source: TradingView
The bulls are struggling to maintain the price above the breakout level of $17.32, suggesting that the bears are active at higher levels. The price has reached the moving averages on the 4-hour chart, which is an important level to keep an eye on. If the price rebounds off the moving averages with strength, the bulls will again try to propel the pair to $18.68.
Contrarily, a break below the moving averages will signal that the bulls are losing their grip. The pair may then tumble to the crucial support of $15.44.
Uniswap price analysis
Uniswap’s (UNI $11.02) recovery picked up momentum after buyers pushed the price above the moving averages on May 20.
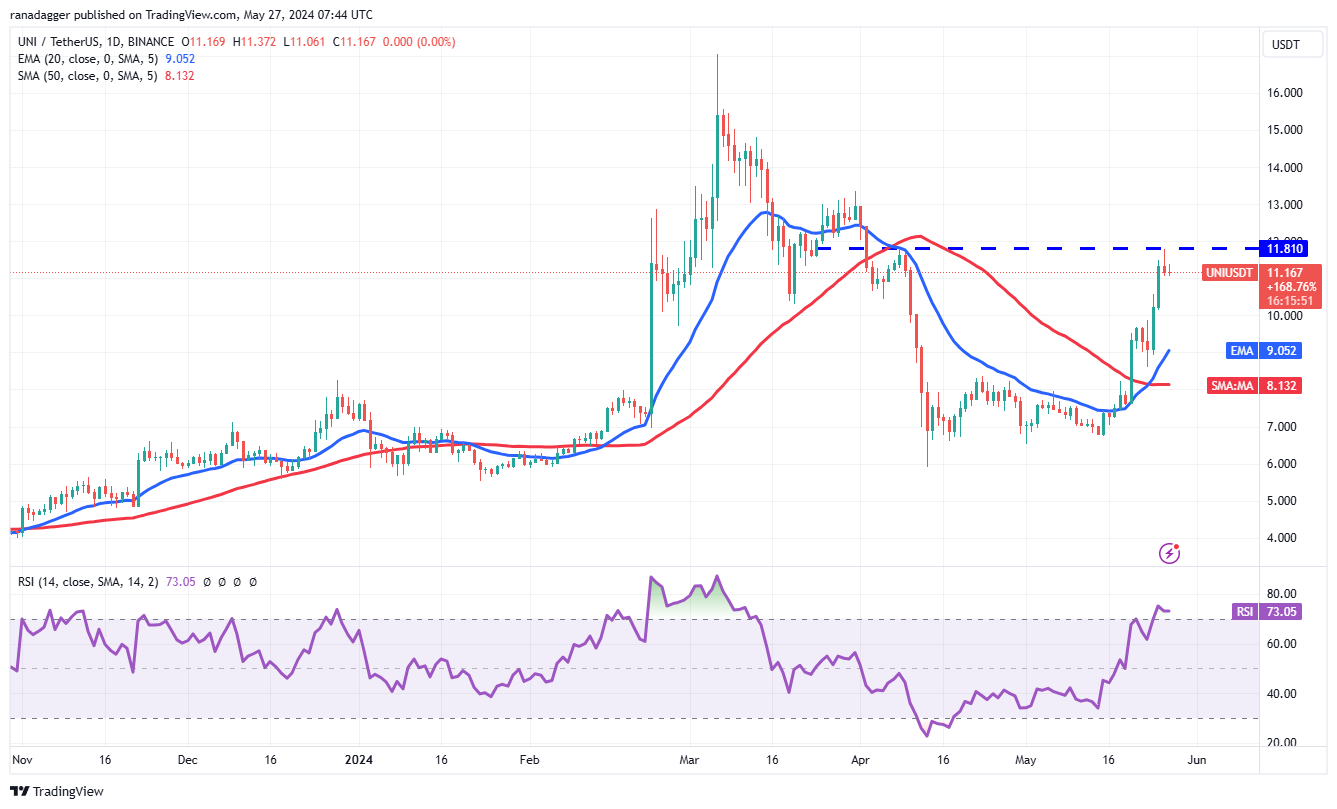
UNI/USDT daily chart. Source: TradingView
The UNI/USDT pair turned down from the overhead resistance of $11.81 on May 26, but If buyers do not cede much ground to the bears, it will increase the likelihood of a break above $11.81. If that happens, the pair could surge to $13.34 and then to $15.
On the contrary, if the price turns down and breaks below $10, it will suggest that the bulls are aggressively booking profits. That could sink the pair to the 20-day EMA ($9.05) and delay the start of the next leg of the up move.
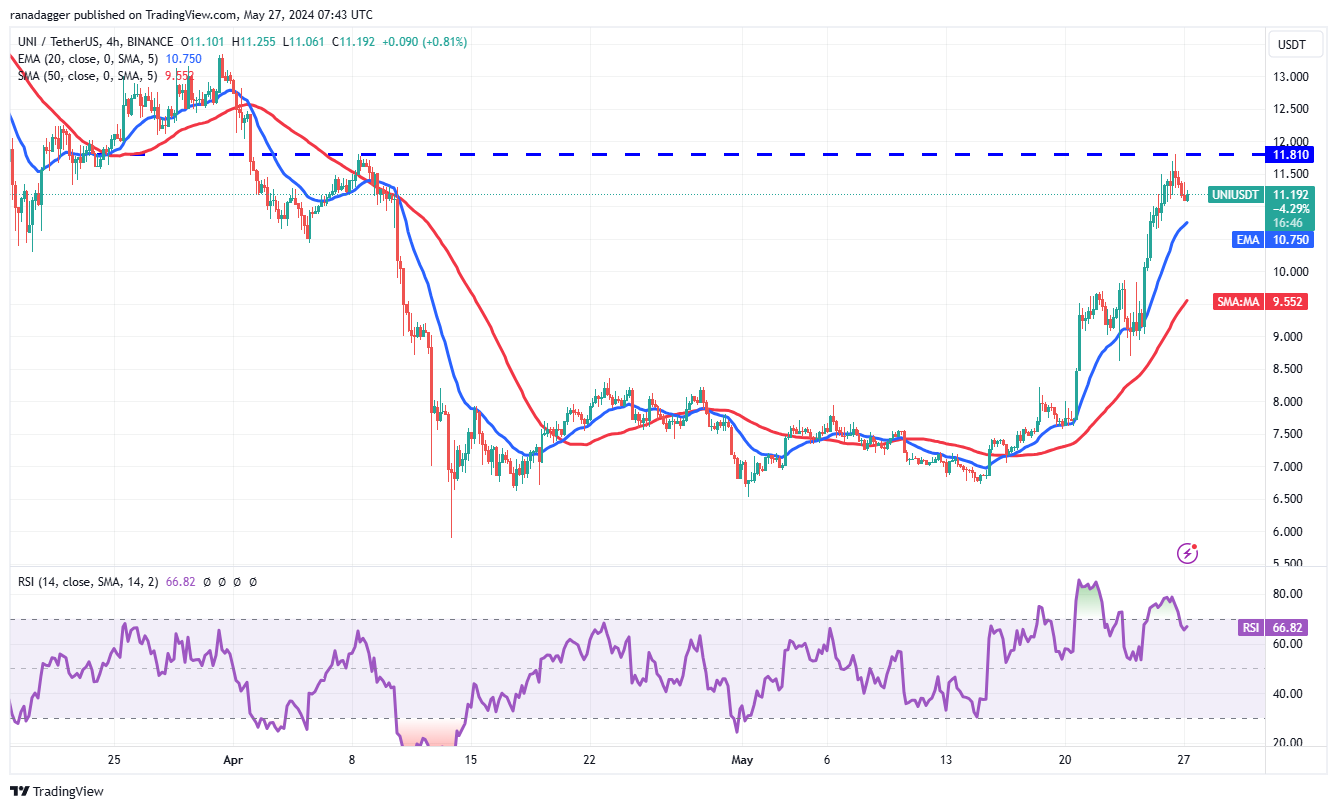
UNI/USDT 4-hour chart. Source: TradingView
The pair has turned down from $11.81, indicating that the bears are fiercely defending the level. The first support to watch out for on the downside is the 20-EMA. A strong rebound off this level will suggest that the sentiment remains positive and traders are viewing the dips as a buying opportunity. That could increase the possibility of a break above $11.81.
Conversely, if the price turns down and breaks below the 20-EMA, it will signal that the bulls are losing their grip. The pair may then collapse to the 50-SMA.
Arbitrum price analysis
Arbitrum (ARB) has been attempting to break above the overhead resistance of $1.27 for the past few days, but the bears have held their ground.
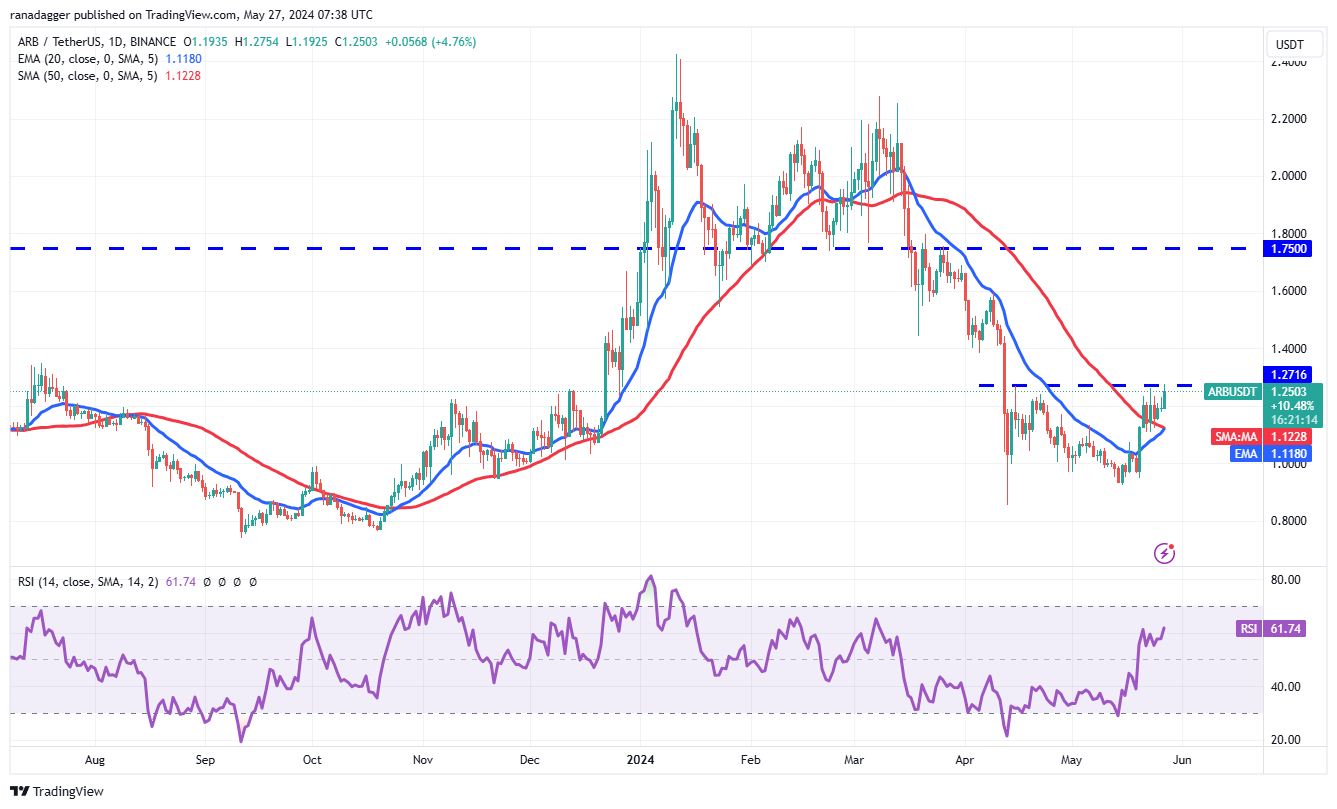
ARB/USDT daily chart. Source: TradingView
However, a minor positive for the bulls is that they have not allowed the price to dip below the 20-day EMA ($1.11). That increases the possibility of a break above the resistance. If that happens, the ARB/USDT pair will likely increase momentum and surge toward $1.60 and eventually to $1.75.
This optimistic view will be negated in the near term if the price turns down sharply and dives below $1.10. That could tug the price down to the strong support near $0.90.
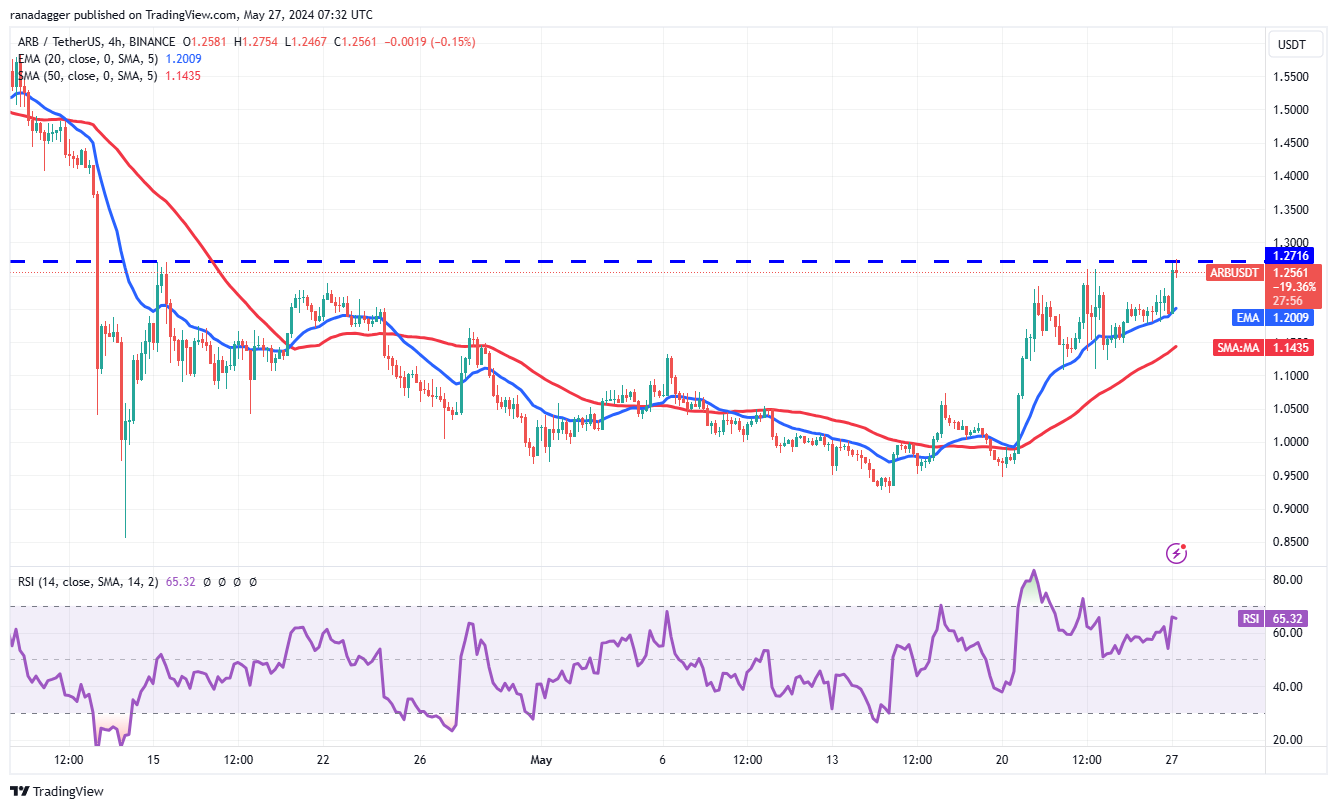
ARB/USDT 4-hour chart. Source: TradingView
The 4-hour chart shows that the pair rebounded sharply off the 20-EMA and has reached the overhead resistance of $1.27. The bears are expected to defend this level, but if the bulls prevail, the pair may accelerate toward $1.40.
If bears want to prevent the upside, they will have to aggressively defend the $1.27 level and sink the pair below the 20-EMA. If they do that, the pair may slump to the strong support at $1.10 where the buyers are likely to step in.
Author

Cointelegraph Team
Cointelegraph
We are privileged enough to work with the best and brightest in Bitcoin.


