|

Bitcoin market overview: BTC/USD bull rally loading or bull trap?

  • Bitcoin revamped the short-term bullish picture with a formidable move past $8,100.
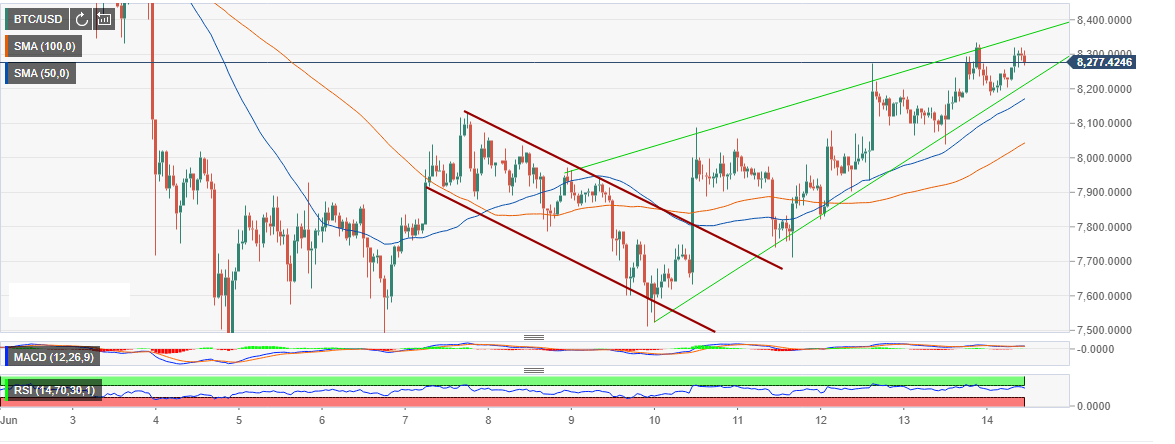
  • Bitcoin rally triggered following a breakout from the bullish flag pattern.

The formation of a rising wedge pattern for BTC/USD trading pair suggests the largest crypto’s rally above $8,000 might not last long. At present, BTC is 9% higher from the weekend low slightly above $7,500. The same $7,500 support anchored Bitcoin declines on June 6.

Bitcoin revamped the short-term bullish picture with a formidable move past $8,100 On June 12. The successive trading sessions have been positive as well. Unfortunately, the trading volumes have remained almost not reactant and the rally is without substance. If anything Bitcoin volume on CoinMarketCap has declined 42% from the highs seen in May at $33 billion to the current $19 billion.

The rally was triggered following a breakout from the bullish flag pattern as observed on the chart. However, the gains have been thinning within a rising wedge pattern suggesting a reversal. For now, Bitcoin is trading at $8,2888 with the initial support at $8,200, $8,100, $7,700 and $7,500.

Bitcoin needs to breach the $8,300 level and focus on correction towards $8,400 in order to be safe and avert the impending danger.

BTC/USD 1-hour chart

Author

John Isige

John Isige

FXStreet

John Isige is a seasoned cryptocurrency journalist and markets analyst committed to delivering high-quality, actionable insights tailored to traders, investors, and crypto enthusiasts. He enjoys deep dives into emerging Web3 tren

More from John Isige
Share:

Editor's Picks

Ripple bulls defend key support amid waning retail demand and ETF inflows

XRP ticks up above $1.40 support, but waning retail demand suggests caution. XRP attracts $4 million in spot ETF inflows on Thursday, signaling renewed institutional investor interest.

Crypto Today: Bitcoin, Ethereum, XRP rebound as risk appetite improves

Bitcoin rises marginally, nearing the immediate resistance of $68,000 at the time of writing on Friday. Major altcoins, including Ethereum and Ripple, hold key support levels as bulls aim to maintain marginal intraday gains.

Bitcoin Weekly Forecast: No recovery in sight 

Bitcoin price continues to trade sideways between $65,729 and $71,746, extending its consolidation since February 7. US-spot ETFs record an outflow of $403.90 million through Thursday, pointing to the fifth consecutive week of withdrawals.

Pi Network Price Forecast: PI recovery stalls amid profit-taking

Pi Network tests 50-day EMA support on Friday, after a 5% decline the previous day. PiScan data shows large deposits on CEXs totaling over 4 million PI tokens in the last 24 hours, reflecting an exodus of investors taking profits.

Bitcoin Price Annual Forecast: BTC holds long-term bullish structure heading into 2026

Bitcoin (BTC) is wrapping up 2025 as one of its most eventful years, defined by unprecedented institutional participation, major regulatory developments, and extreme price volatility.

Bitcoin: No recovery in sight

Bitcoin (BTC) price continues to trade within a range-bound zone, hovering around $67,000 at the time of writing on Friday, and falling slightly so far this week, with no signs of recovery.