• Bitcoin consolidates the sell-off from near $ 12450 region.
  • Massive resistance levels are stacked up around the 12k mark.

The weekend love for the dominant cryptocurrency, Bitcoin, appears to remain unabated, despite a brief aberration seen earlier today.  However, traders witness a tug of war between the bulls and bears over the last hours, leaving the prices consolidating in a tight range between 11850- 11375 levels.

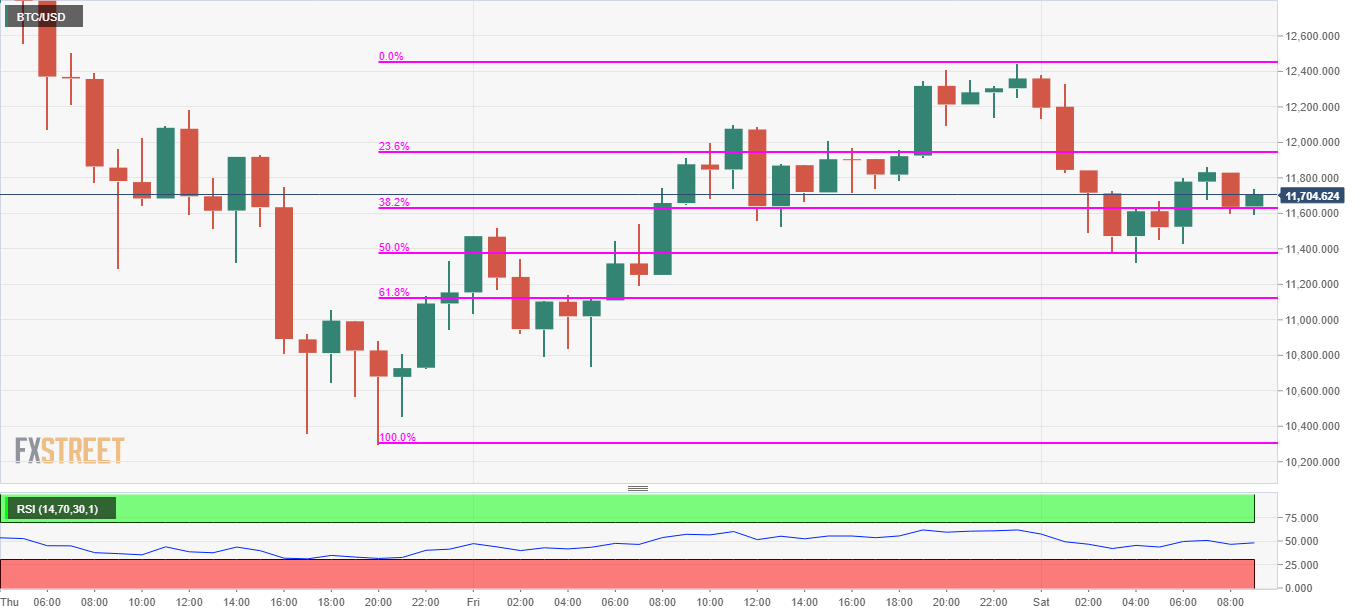
The bulls are seen trying hard to take on the recovery, but a bunch of stiff resistance is lined up around the 12000 levels. That area coincides with the 23.6% Fibonacci retracement (Fib) of Friday’s corrective upside on the hourly chart.

According to Tanya Abrosimova, Cryptocurrencies News Editor at FXStreet, “the recovery above $12,000 is regarded as a pre-condition needed to resume the movement within the long-term upside trend. As long as the price stays below the said barrier, we are in for range-bound trading. However, once it is cleared, the upside is likely to gain traction with the next focus on $12,600. This resistance is created by the upper boundary o 1-day Bollinger Band. The next critical barrier awaits us on approach to $13,000 followed by the recent high of $13,700.” 

On the flip side, a break below the 50% Fib level near 11,375 is needed for the bears to regain complete control, opening floors for a retest of the 10,300 level. However, the prices appear to take a breather after a volatile week, with the Relative Strength Index holding steady just shy of the 50 mark.  

To conclude, Bitcoin appears to wait for fresh catalyst for the next direction while the bulls continue to struggle below the 12,000 mark.

BTC/USD 1-hour chart

Levels to watch

BTC/USD

Overview
Today last price 11593.07
Today Daily Change -767.39
Today Daily Change % -6.21
Today daily open 12360.46
 
Trends
Daily SMA20 9691.99
Daily SMA50 8623
Daily SMA100 6788.54
Daily SMA200 5238.21
Levels
Previous Daily High 12444.48
Previous Daily Low 10739.16
Previous Weekly High 13862.09
Previous Weekly Low 10300.04
Previous Monthly High 9090.94
Previous Monthly Low 5266.72
Daily Fibonacci 38.2% 11793.05
Daily Fibonacci 61.8% 11390.59
Daily Pivot Point S1 11251.59
Daily Pivot Point S2 10142.72
Daily Pivot Point S3 9546.27
Daily Pivot Point R1 12956.9
Daily Pivot Point R2 13553.35
Daily Pivot Point R3 14662.22


Information on these pages contains forward-looking statements that involve risks and uncertainties. Markets and instruments profiled on this page are for informational purposes only and should not in any way come across as a recommendation to buy or sell in these assets. You should do your own thorough research before making any investment decisions. FXStreet does not in any way guarantee that this information is free from mistakes, errors, or material misstatements. It also does not guarantee that this information is of a timely nature. Investing in Open Markets involves a great deal of risk, including the loss of all or a portion of your investment, as well as emotional distress. All risks, losses and costs associated with investing, including total loss of principal, are your responsibility. The views and opinions expressed in this article are those of the authors and do not necessarily reflect the official policy or position of FXStreet nor its advertisers. The author will not be held responsible for information that is found at the end of links posted on this page.

If not otherwise explicitly mentioned in the body of the article, at the time of writing, the author has no position in any stock mentioned in this article and no business relationship with any company mentioned. The author has not received compensation for writing this article, other than from FXStreet.

FXStreet and the author do not provide personalized recommendations. The author makes no representations as to the accuracy, completeness, or suitability of this information. FXStreet and the author will not be liable for any errors, omissions or any losses, injuries or damages arising from this information and its display or use. Errors and omissions excepted.

The author and FXStreet are not registered investment advisors and nothing in this article is intended to be investment advice.

Join Telegram

Recommended content


Recommended Content

Editors’ Picks

Ripple wipes out weekly gains, experts comment on role of Ripple stablecoin

Ripple wipes out weekly gains, experts comment on role of Ripple stablecoin

Ripple declined to $0.52 on Thursday, erasing all gains registered earlier this week. Ripple SVP Eric van Miltenburg’s comments on the firm’s stablecoin, and how it is expected to benefit the XRP Ledger and native token XRP have raised concerns among crypto experts. 

More Ripple News

Hedera HBAR slips nearly 10% after air is cleared on mistaken link with giant BlackRock

Hedera HBAR slips nearly 10% after air is cleared on mistaken link with giant BlackRock

HBAR price is down nearly 10% on Thursday, partly erasing gains inspired by the misinterpreted link with BlackRock. Despite the recent correction, Hedera’s price is up 44% in the past seven days.

More Hedera News

The reason behind Bonk’s 105% rise and if you should buy now Premium

The reason behind Bonk’s 105% rise and if you should buy now

Bonk price has shot up 105% in the past five weeks. A retracement into $0.0000216 or the $0.0000152 to $0.0000186 imbalance would be a good buying opportunity. Patient investors can expect double-digit gains from BONK that could extend up to 70%.

More Cryptocurrencies News

Injective price weakness persists despite over 5.9 million INJ tokens burned

Injective price weakness persists despite over 5.9 million INJ tokens burned

Injective price is trading with a bearish bias, stuck in the lower section of the market range. The bearish outlook abounds despite the network's deflationary efforts to pump the price. Coupled with broader market gloom, INJ token’s doomed days may not be over yet.

More Injective News

Bitcoin: BTC post-halving rally could be partially priced in Premium

Bitcoin: BTC post-halving rally could be partially priced in

Bitcoin (BTC) price briefly slipped below the $60,000 level for the last three days, attracting buyers in this area as the fourth BTC halving is due in a few hours. Is the halving priced in for Bitcoin? Or will the pioneer crypto note more gains in the coming days? 

Read full analysis

BTC

ETH

XRP