Bitcoin extends decline – Is a larger breakdown coming?
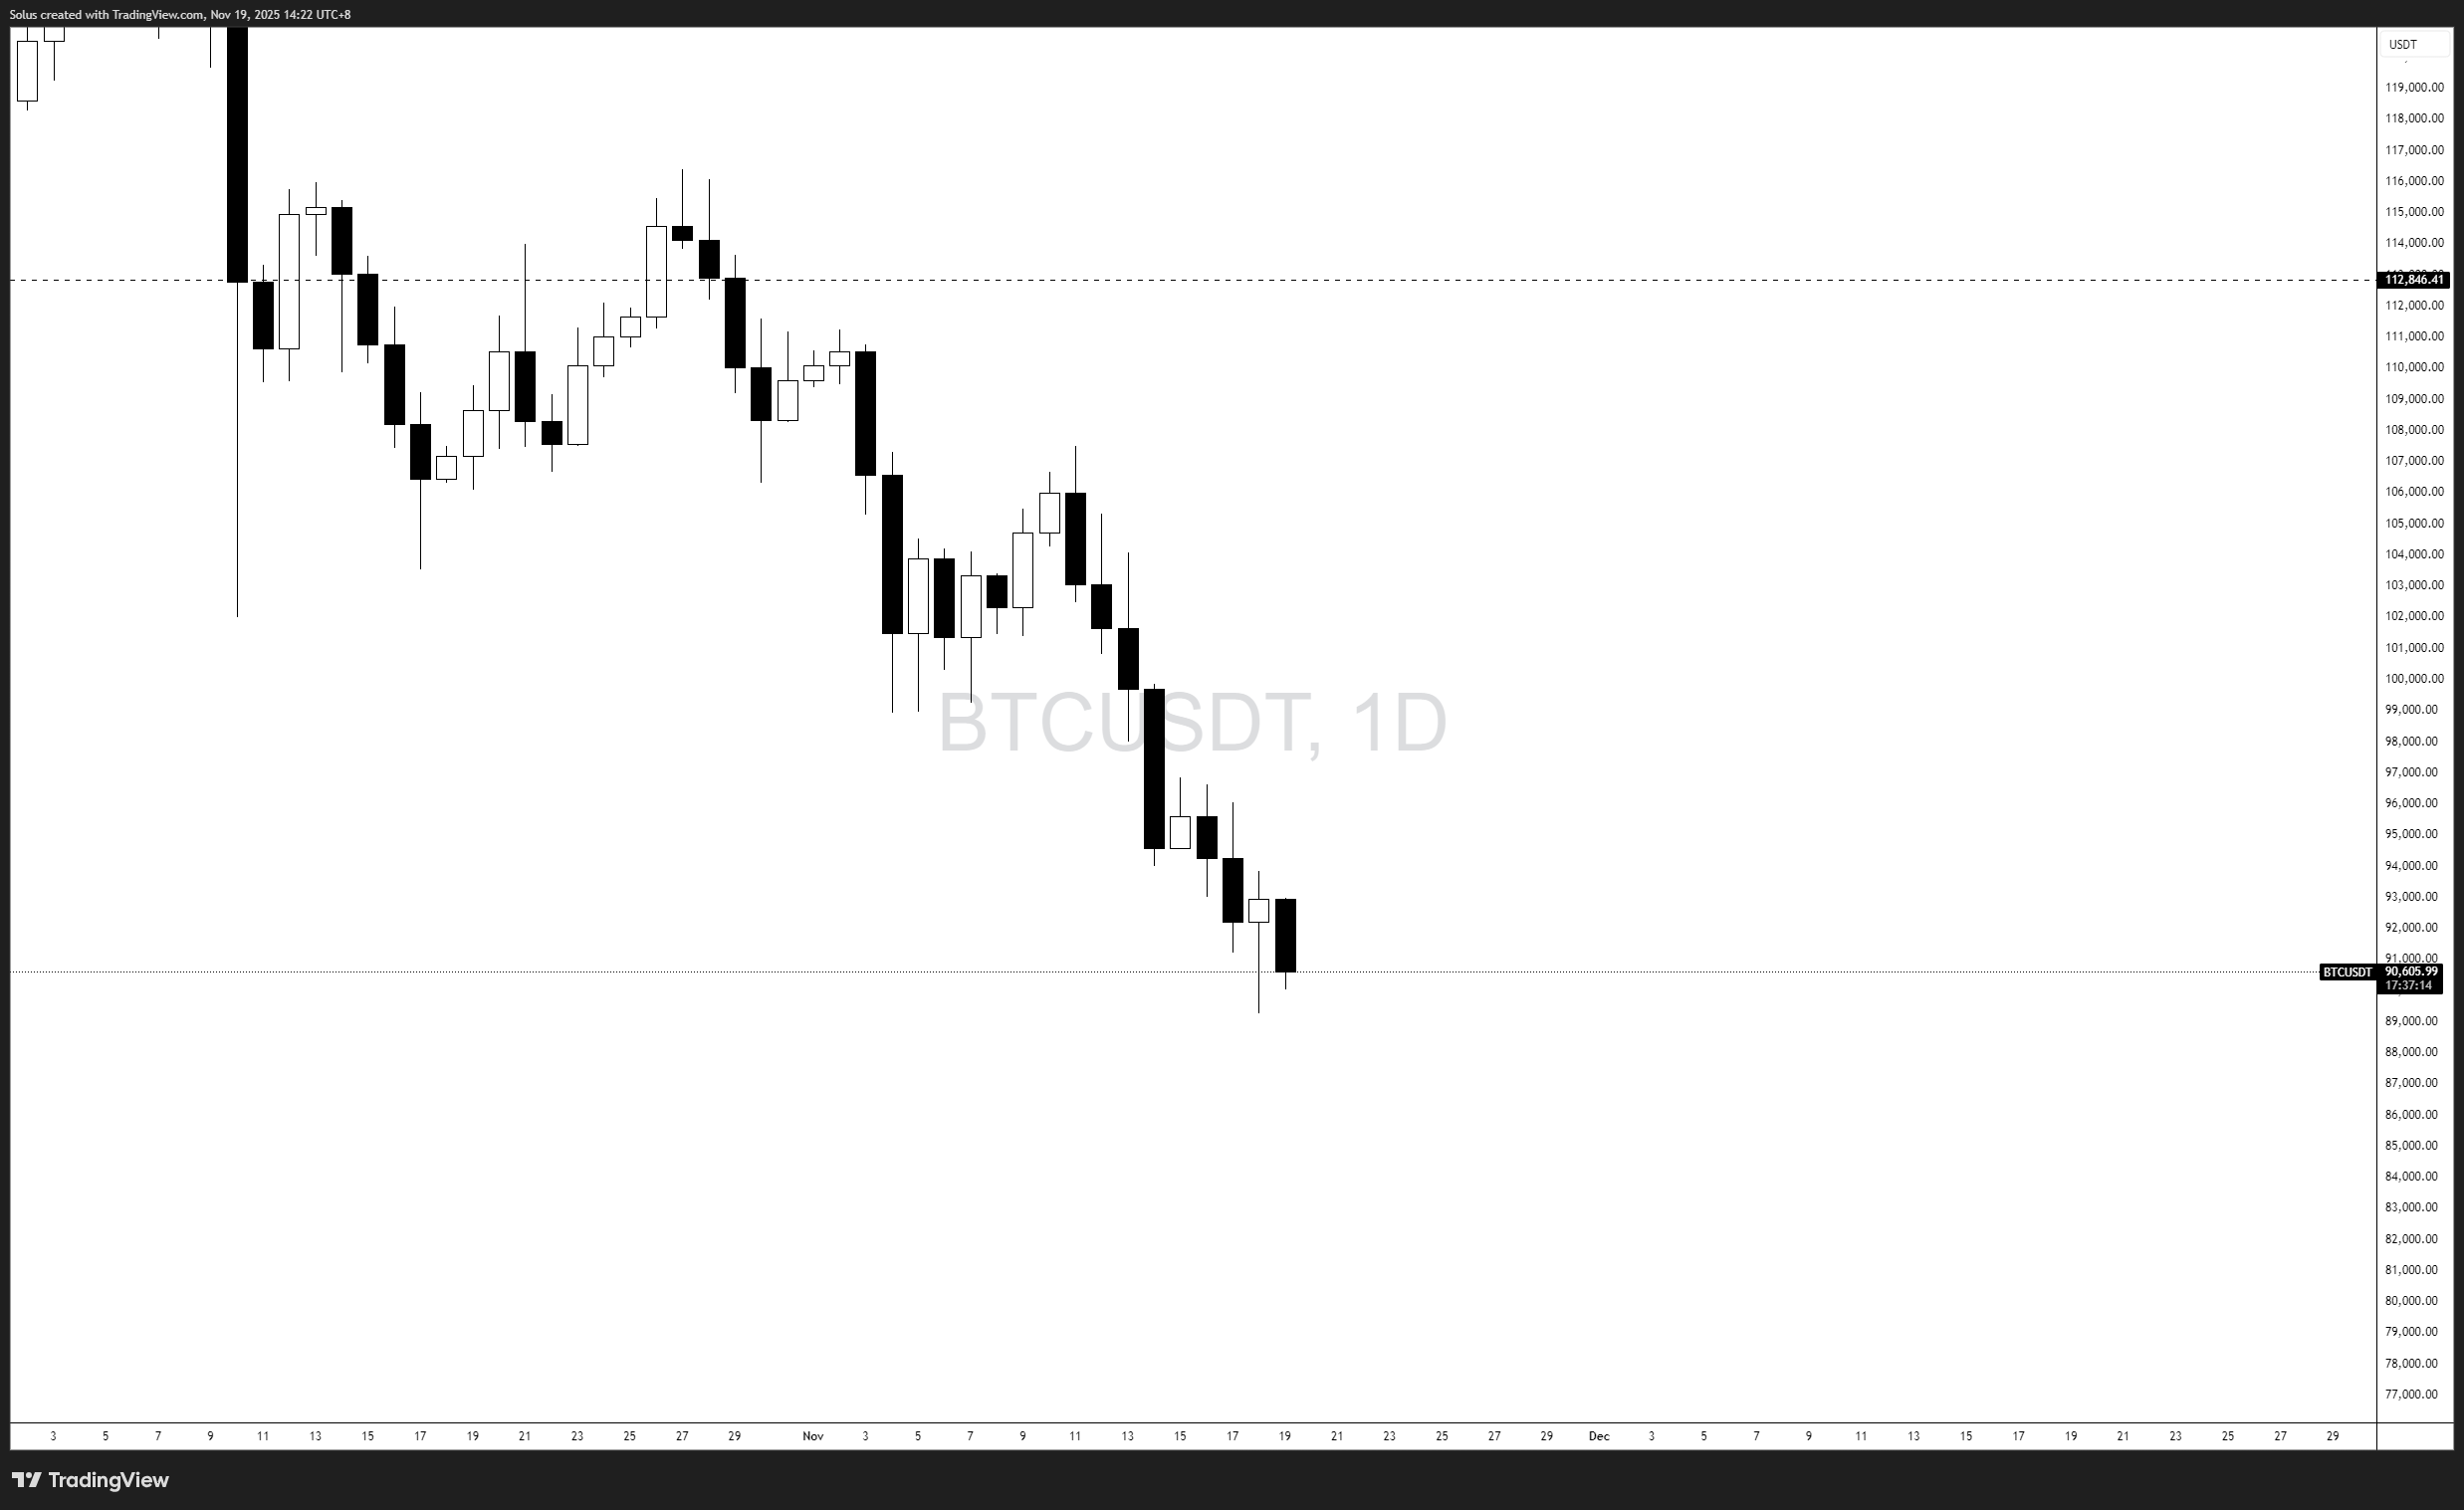
- Bitcoin continues its controlled selloff, pressing deeper into the Weekly Fair Value Gap, where the market is attempting to stabilize after weeks of consistent lower-timeframe weakness.
- Macro risk-off sentiment, cooling ETF flows, and a structurally bearish chart remain the main drivers behind Bitcoin’s decline.
- BTC must hold the 86,500–92,000 Weekly FVG to produce a relief rally. A clean breakdown opens the path toward the Weekly Order Block at 83,000–78,000.

Why Bitcoin is selling off – The real drivers behind the drop
Bitcoin’s decline is not caused by a single headline. It’s the result of a convergence of macro and technical pressures:
1. A global risk-off phase is returning
Markets have rotated back into defensive positioning:
- Stronger USD environment.
- Mixed equity sentiment.
- Tightening liquidity conditions.
Crypto is the most sensitive risk asset. When liquidity dries up, Bitcoin typically reacts first — and hardest.
2. Cooling ETF demand
Spot ETF inflows were the backbone of Bitcoin’s earlier rally. But over recent weeks:
- Daily inflows have slowed.
- Net flows are flattening.
- Institutional activity is less aggressive.
This reduces consistent bid support and makes every downside move more pronounced.
3. Thin liquidity amplifying each move
Market depth is weakening:
- Lower stablecoin inflow.
- Less capital entering futures markets.
- Funding rates turning mildly negative.
Combined with a bearish trend, this creates an environment where each sell impulse extends further than expected.
4. Technical breakdown catalyzing additional selling
Once Bitcoin broke below the 96,000–98,000 support, the trend flipped decisively.
Since then:
- Lower highs continue on every bounce.
- Candle bodies are large on sell days, tight on retracements.
- Weekly inefficiencies below are pulling price downward.
This is one of the cleanest bearish structures Bitcoin has shown in months — and until something shifts, the bias remains lower.
Overall narrative: BTC’s trend is bearish, but now at a decision point
Bitcoin is now trading inside a large Weekly Fair Value Gap between 92,000 and 86,500 — an area where the market should attempt to react if buyers want to stop the bleeding.
The zone acts as:
- A magnet for price.
- A potential area for higher-timeframe reaccumulation.
- A dividing line between a corrective pullback and a deeper trend reversal.
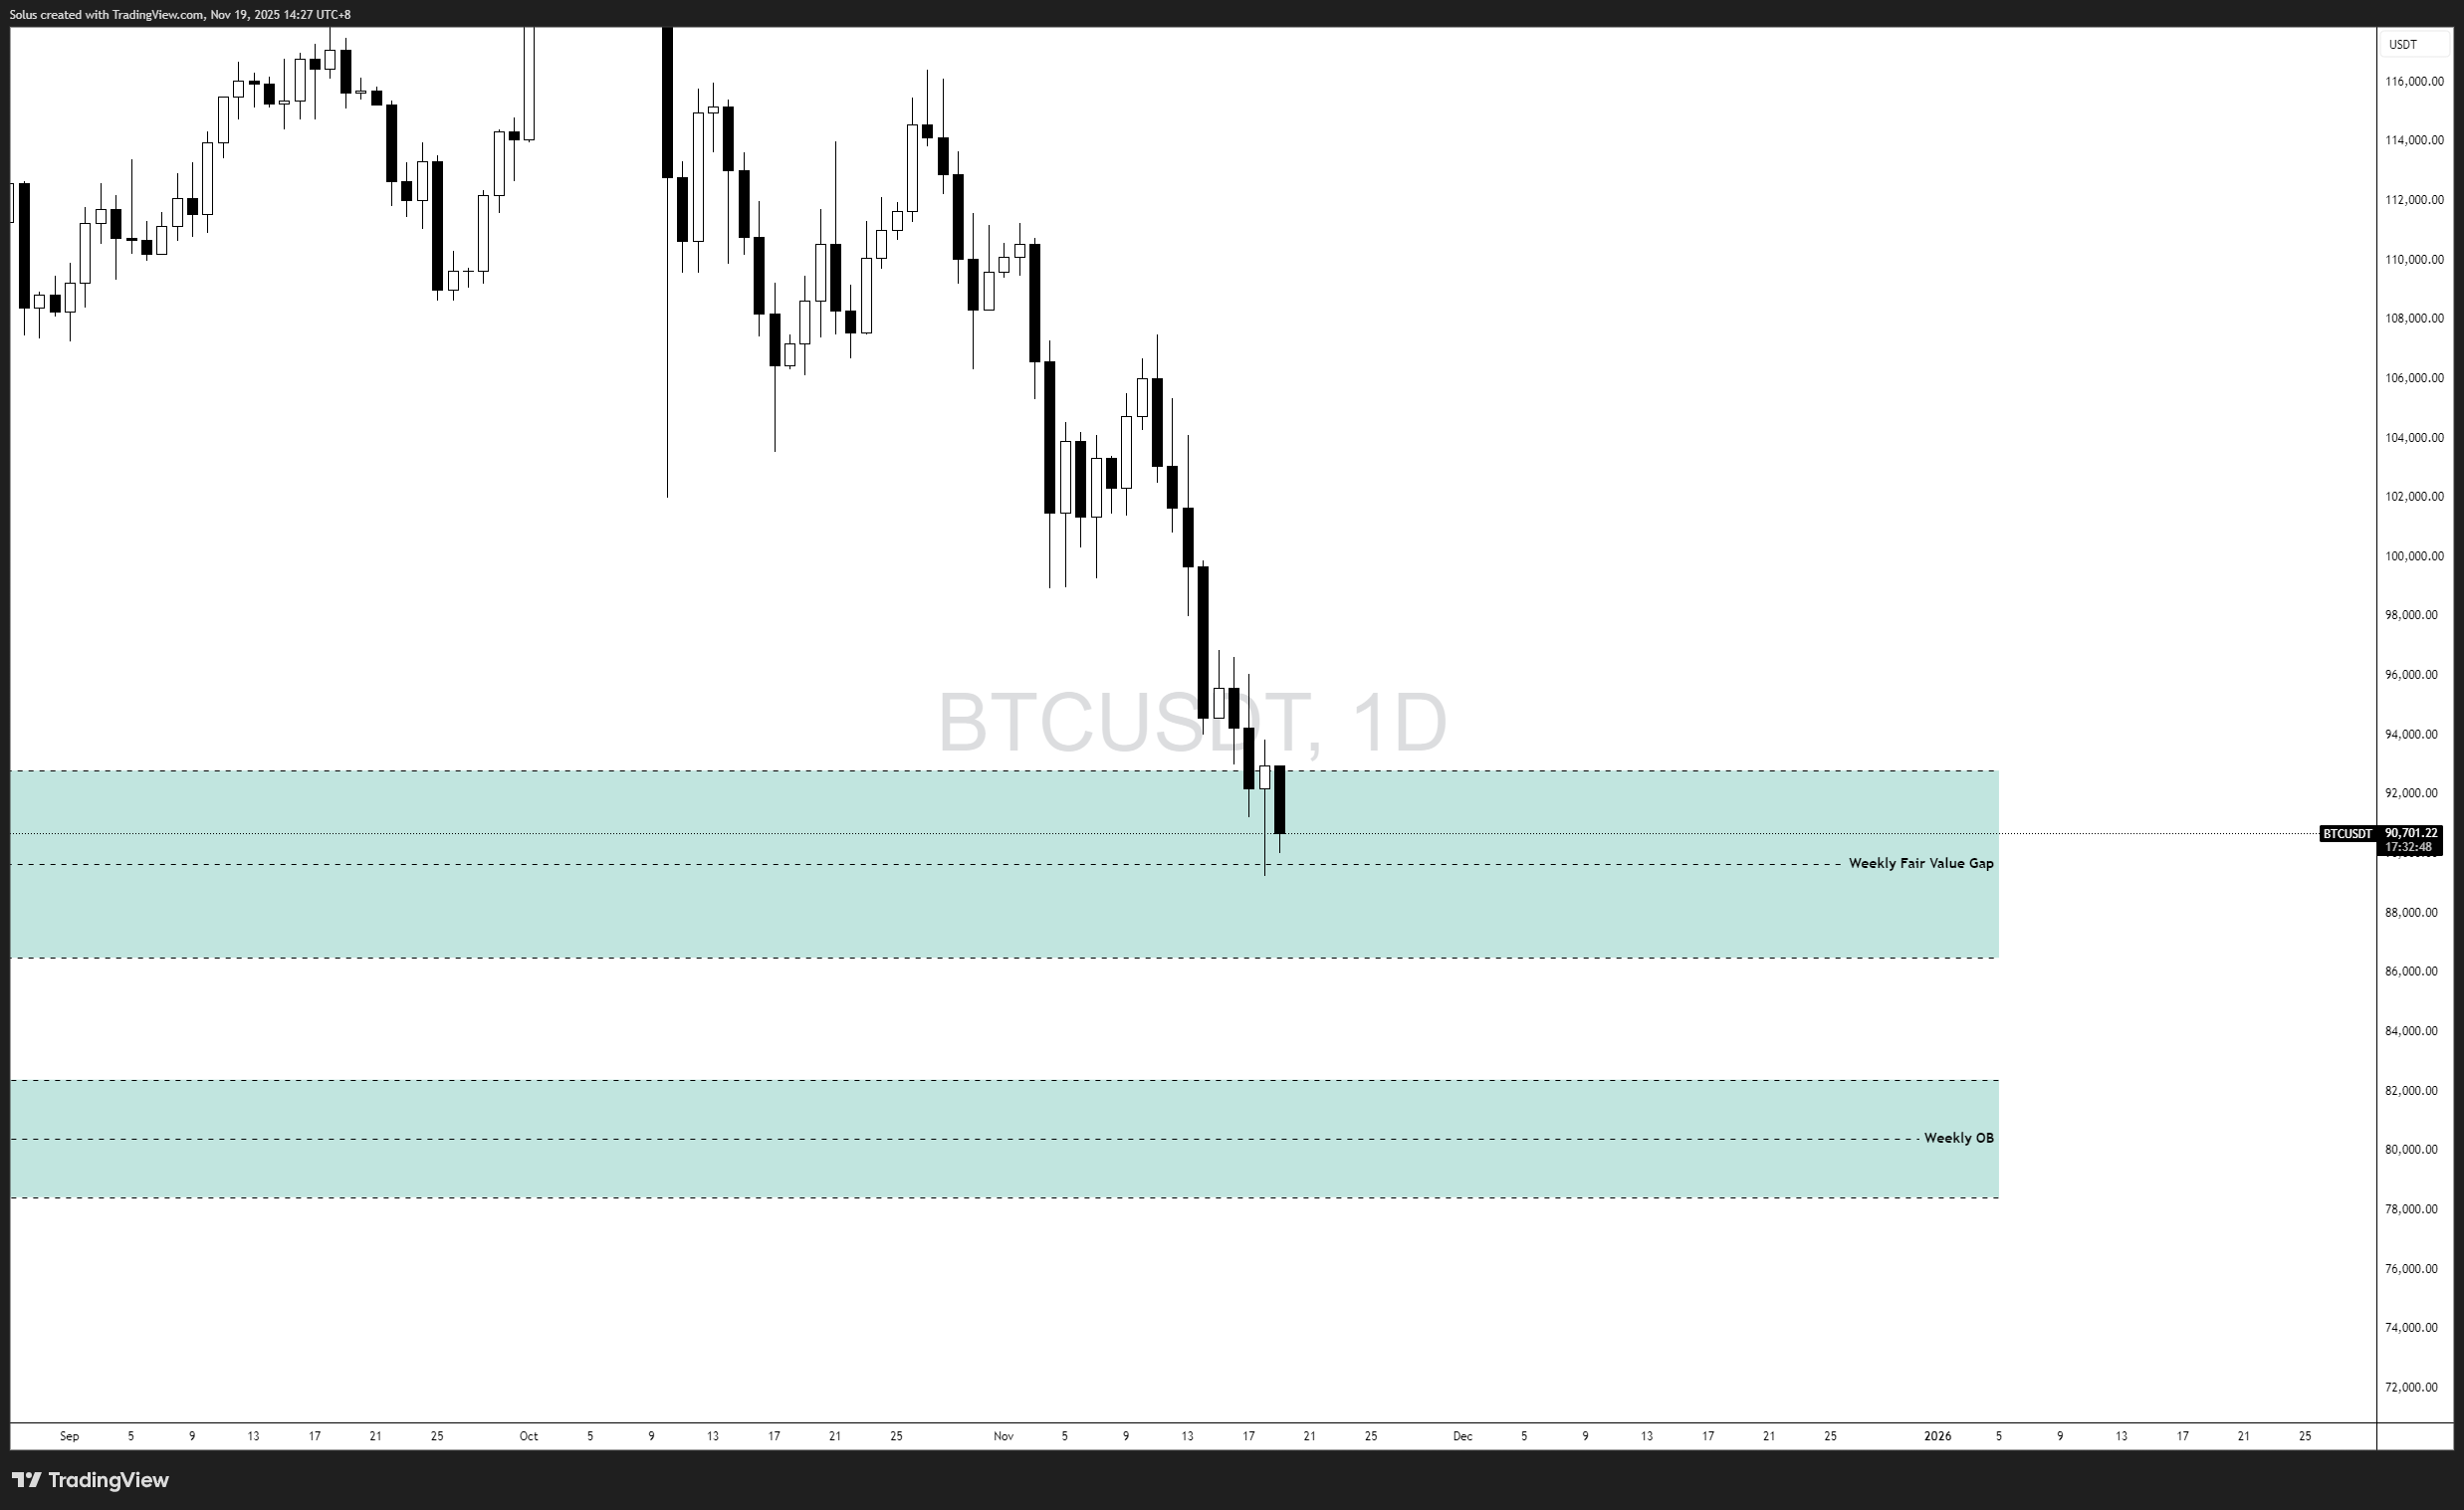
However, if this FVG fails, BTC opens a much larger downside toward a Weekly Order Block at 83,000–78,000 — your next major higher-timeframe liquidity pocket.
Technical outlook
Bitcoin remains in a well-defined downtrend across both the 1D and 4H charts:
- Daily: Lower highs, lower lows, and bearish candle bodies dominating.
- 4H: Impulsive sell legs, shallow pullbacks, and FVG violations on every bounce.
- Market Structure: No bullish break of structure yet on any meaningful timeframe.
BTC is now sitting at the mid-section of the Weekly FVG. The next daily candles will determine if this becomes:
- A bullish reaction zone, or
- A bearish continuation platform.
Bullish scenario – Weekly FVG defends and BTC attempts a relief rally
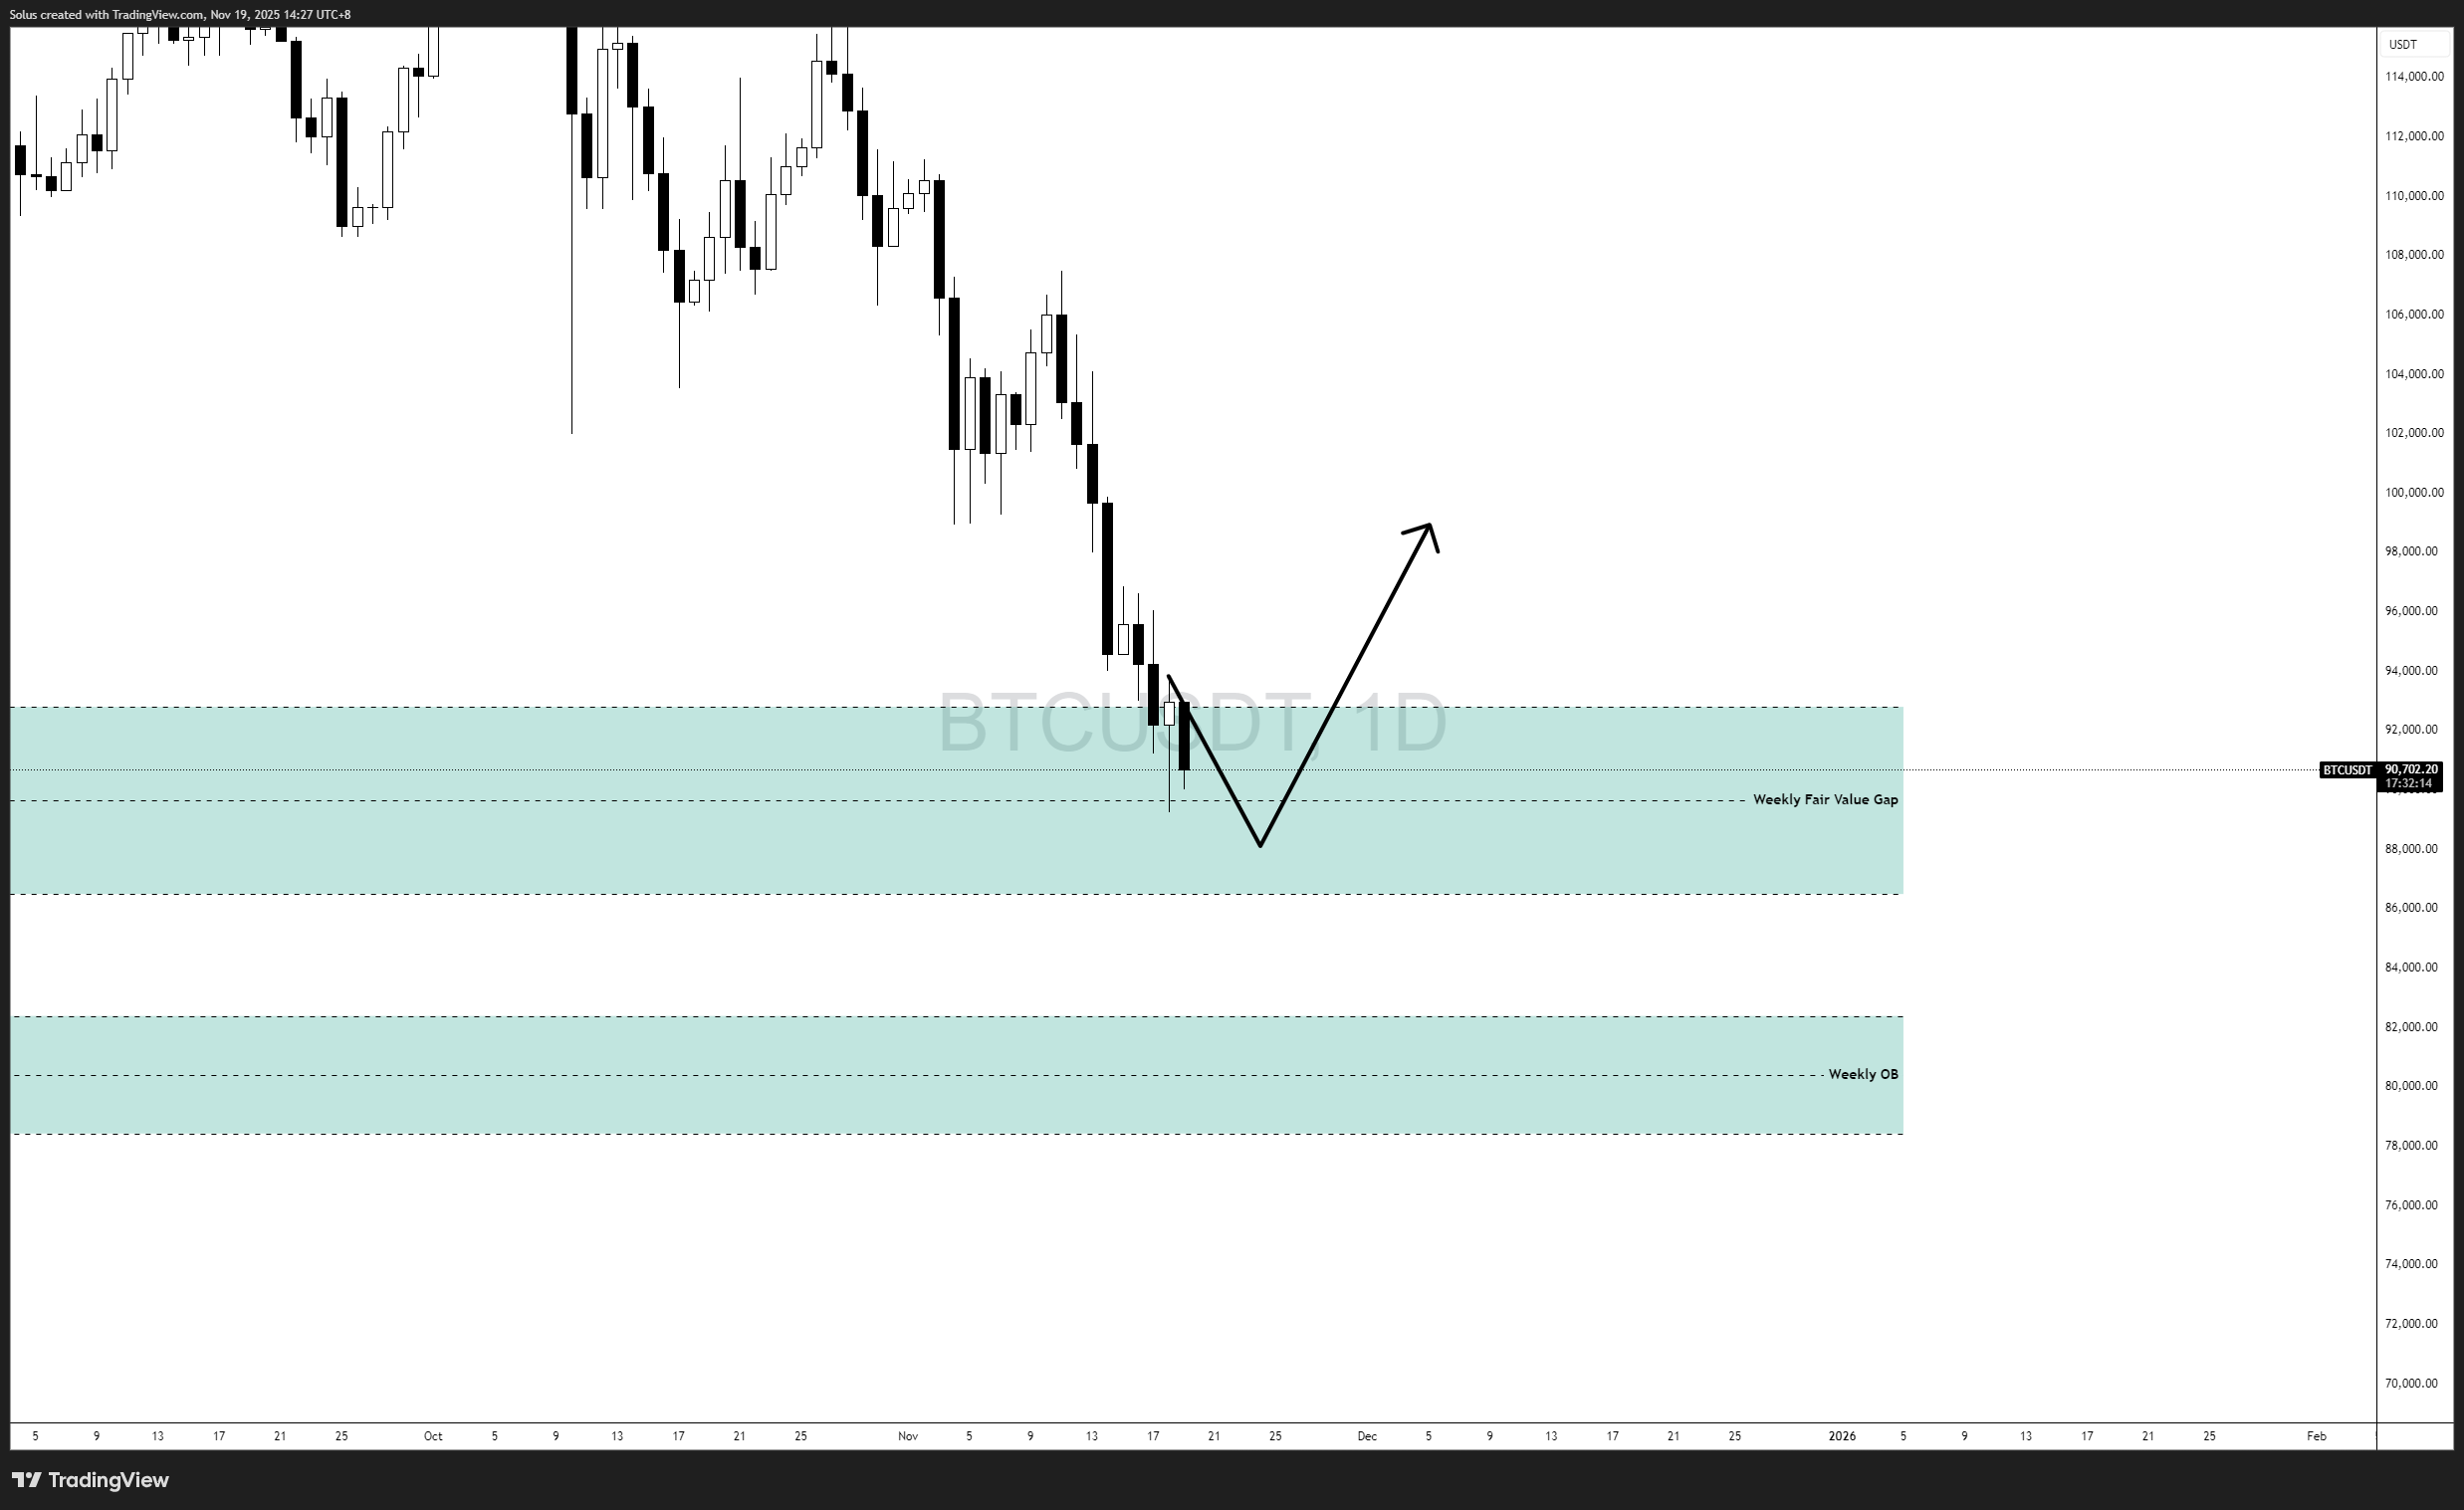
This matches your second chart.
For a bullish correction to emerge, Bitcoin must:
1. Hold the weekly FVG (92,000–86,500)
This is the last major structure before weekly imbalance opens further downside.
2. Produce a sweep-and-reclaim
Ideal bullish reaction:
- Price dips toward 87,000–86,500.
- Wicks below current lows.
- Reclaims back inside the FVG with strength.
This indicates absorption of sell pressure.
3. Break above 93,000–94,000
This level is essential:
- It is the first 4H lower-high
- It’s also the midpoint of the imbalance
- A break here creates a market structure shift
4. Upside targets
If BTC confirms the shift:
- 94,000–96,000: first corrective target.
- 98,000: prior broken support.
- 100,000–102,000: extended retracement and upside inefficiency.
This scenario does not signal a full bottom — only a structured corrective rally inside a broader downtrend.
Bearish scenario – BTC rejects FVG and drops into weekly OB
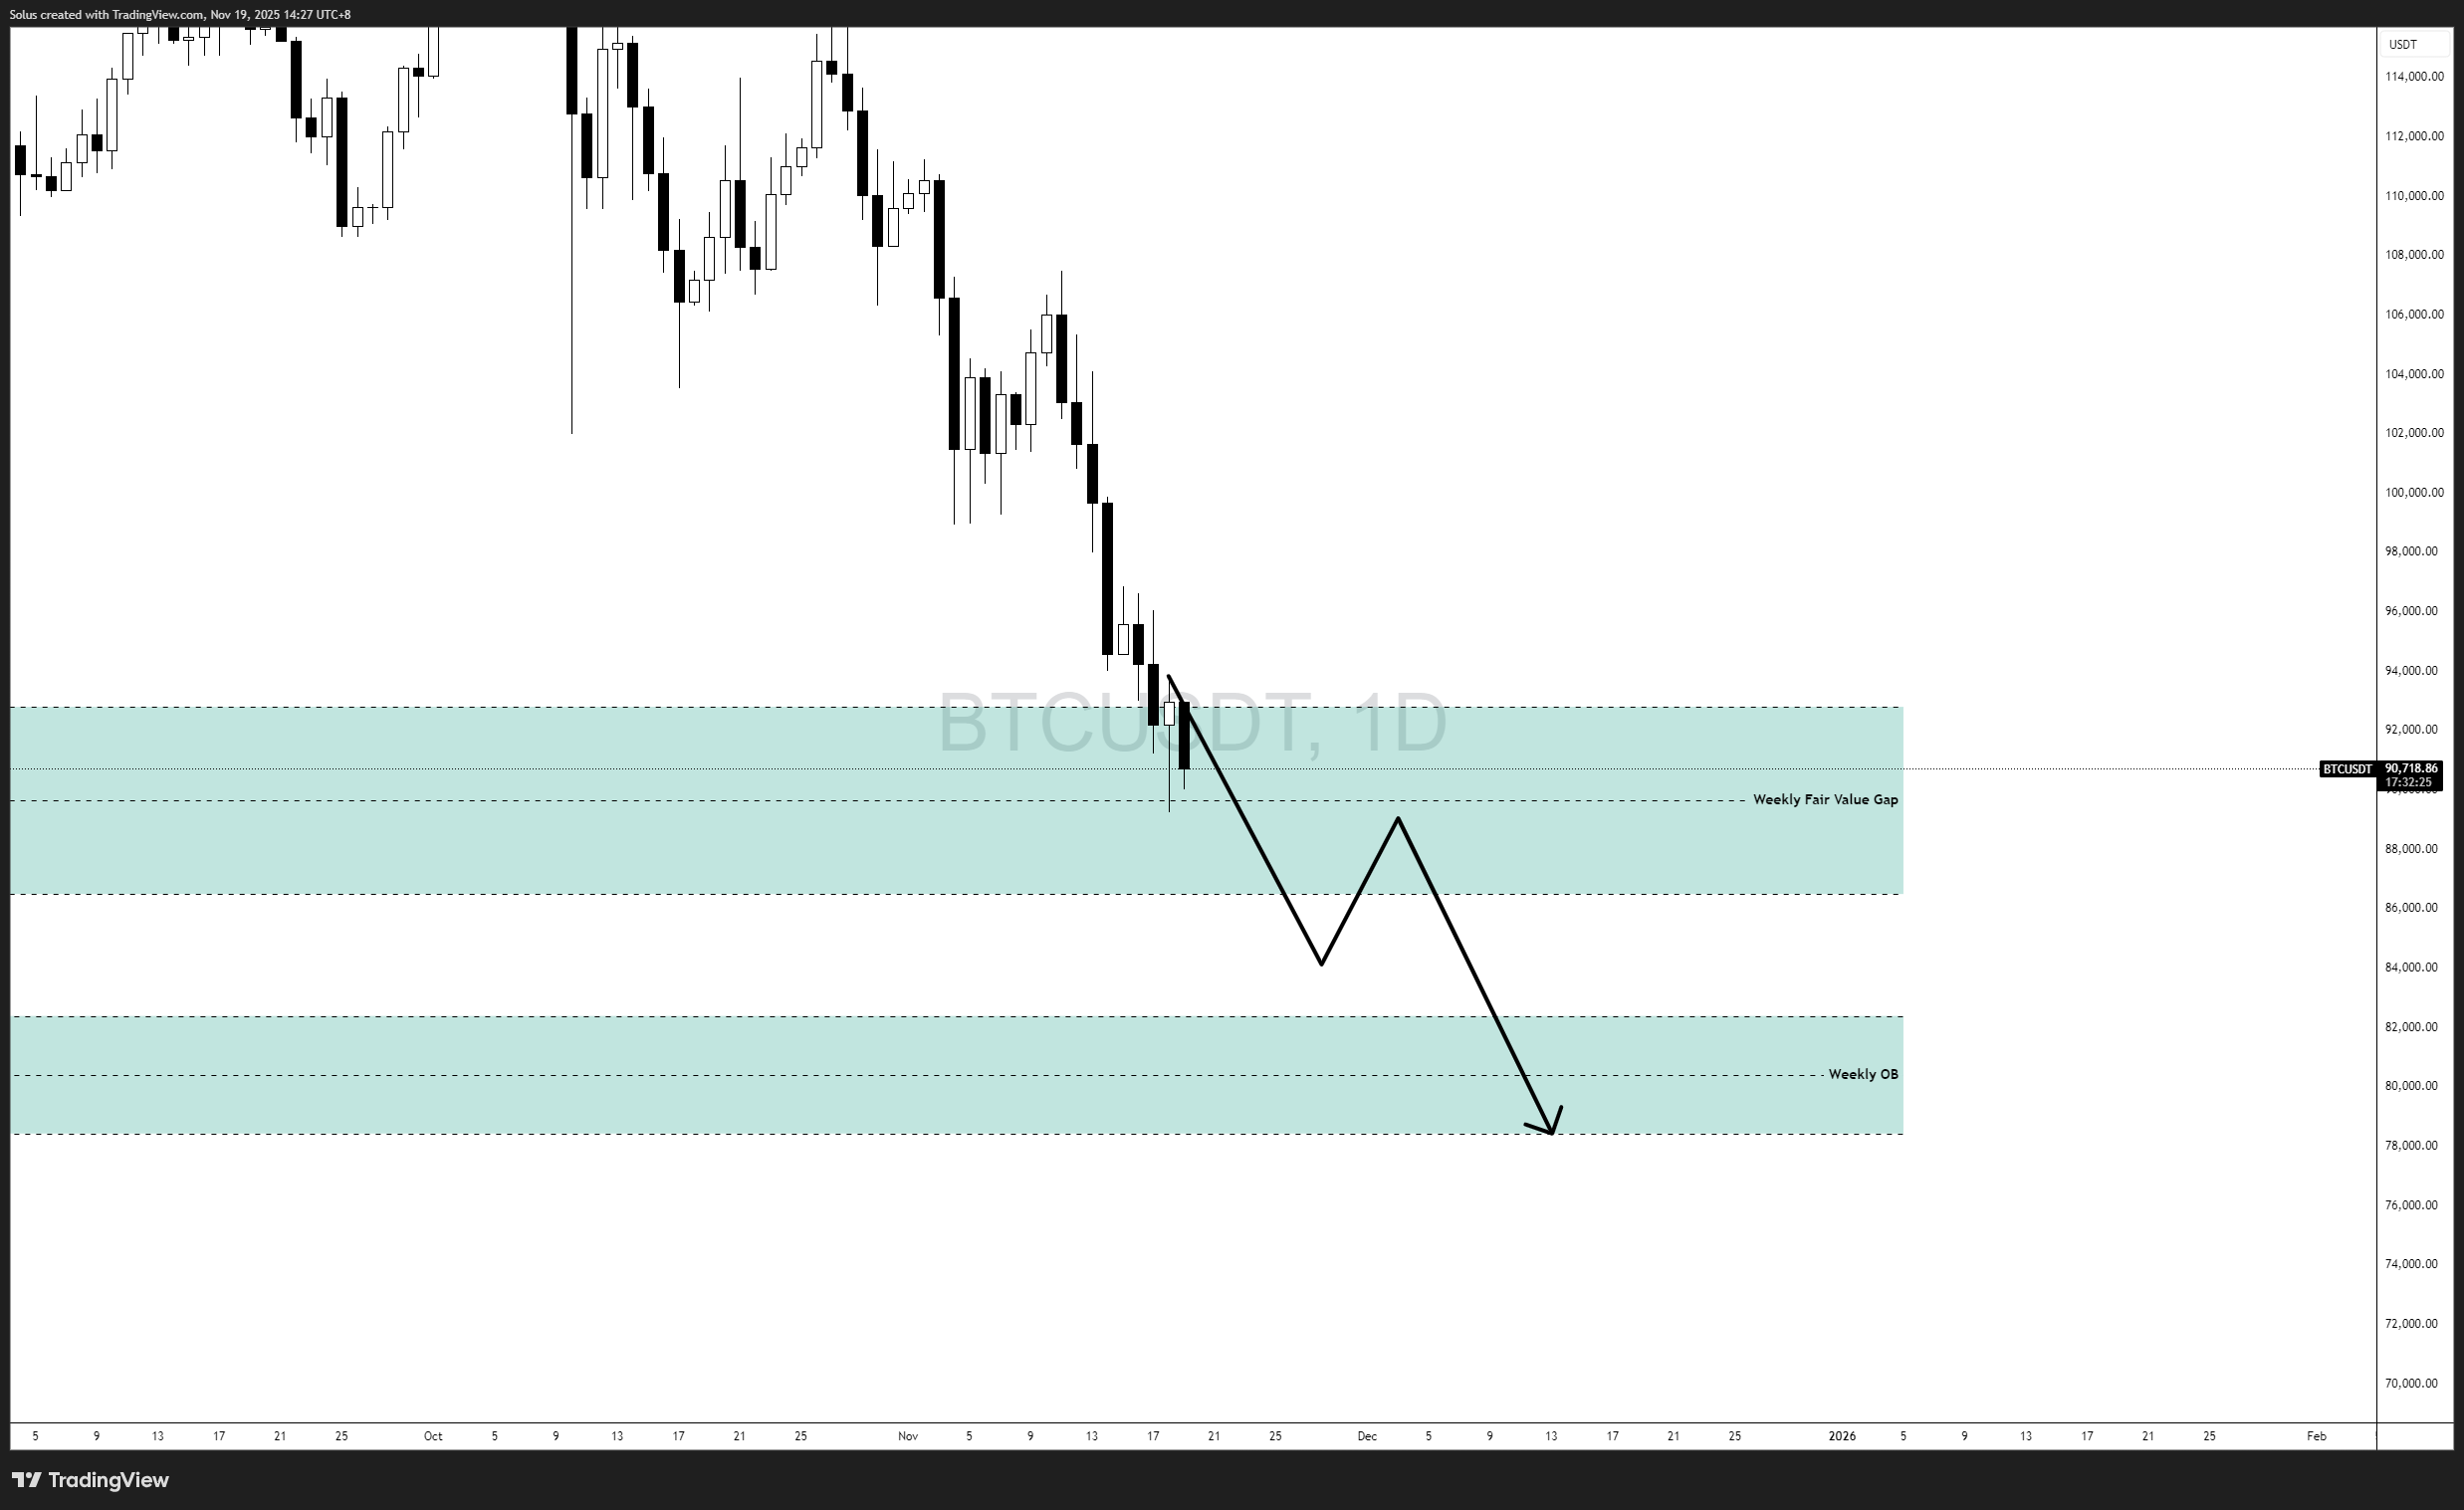
This matches your first chart.
If Bitcoin fails to regain control inside the Weekly FVG:
1. Rejection below 92,000–89,000 confirms weakness
Any reaction that stalls under the upper FVG boundary implies sellers remain dominant.
2. Break below 86,500 is the trigger
A clean daily close beneath this level activates the next leg.
3. Minor pullback – lower high – continuation
Structure likely follows the drawn path:
- Pullback into 88,000–90,000.
- Failure to break higher.
- Continuation toward Weekly OB.
4. Downside targets
- 83,000: top of Weekly OB.
- 80,000: midpoint of OB.
- 78,000: full sweep of the block.
This is currently the higher-probability scenario until proven otherwise.
Final thoughts
Bitcoin is now testing a critical higher-timeframe zone.
The trend is still bearish, but the location signals that the market is nearing an inflection point.
Two simple rules define the next major move:
- Hold 86,500 – relief rally possible.
- Lose 86,500 – 83,000–78,000 becomes inevitable.
Until BTC reclaims 93,000–94,000, any upside remains corrective — not a trend reversal.
Author

Jasper Osita
Independent Analyst
Jasper has been in the markets since 2019 trading currencies, indices and commodities like Gold. His approach in the market is heavily accompanied by technical analysis, trading Smart Money Concepts (SMC) with fundamentals in mind.