Bitcoin, Ethereum and XRP defend key support on sixth day of Israel-Iran war, what to expect
- Bitcoin holds steady above $100,000 support, trades less than 10% away from all-time high.
- Ethereum consolidates above $2,400, a key support level, amidst moderate institutional capital inflows.
- XRP trades rangebound for the third consecutive week, even as Ripple makes strides in partnerships and development.
- Israel-Iran war failed to rattle crypto traders, sentiment remains “neutral” on Wednesday.

Bitcoin (BTC), Ethereum (ETH), and XRP are holding steady above key support levels. The top three cryptocurrencies have weathered the geopolitical tension and macroeconomic events of the past week.
Bitcoin collected liquidity at $102,664 on Friday as the Israel-Iran war escalated, with the crypto King consolidating above this support level since then. Meanwhile, Ethereum and XRP price action has largely remained rangebound over the last six days, as cryptocurrency traders are not as rattled as the market would expect in the wake of Middle East tensions.
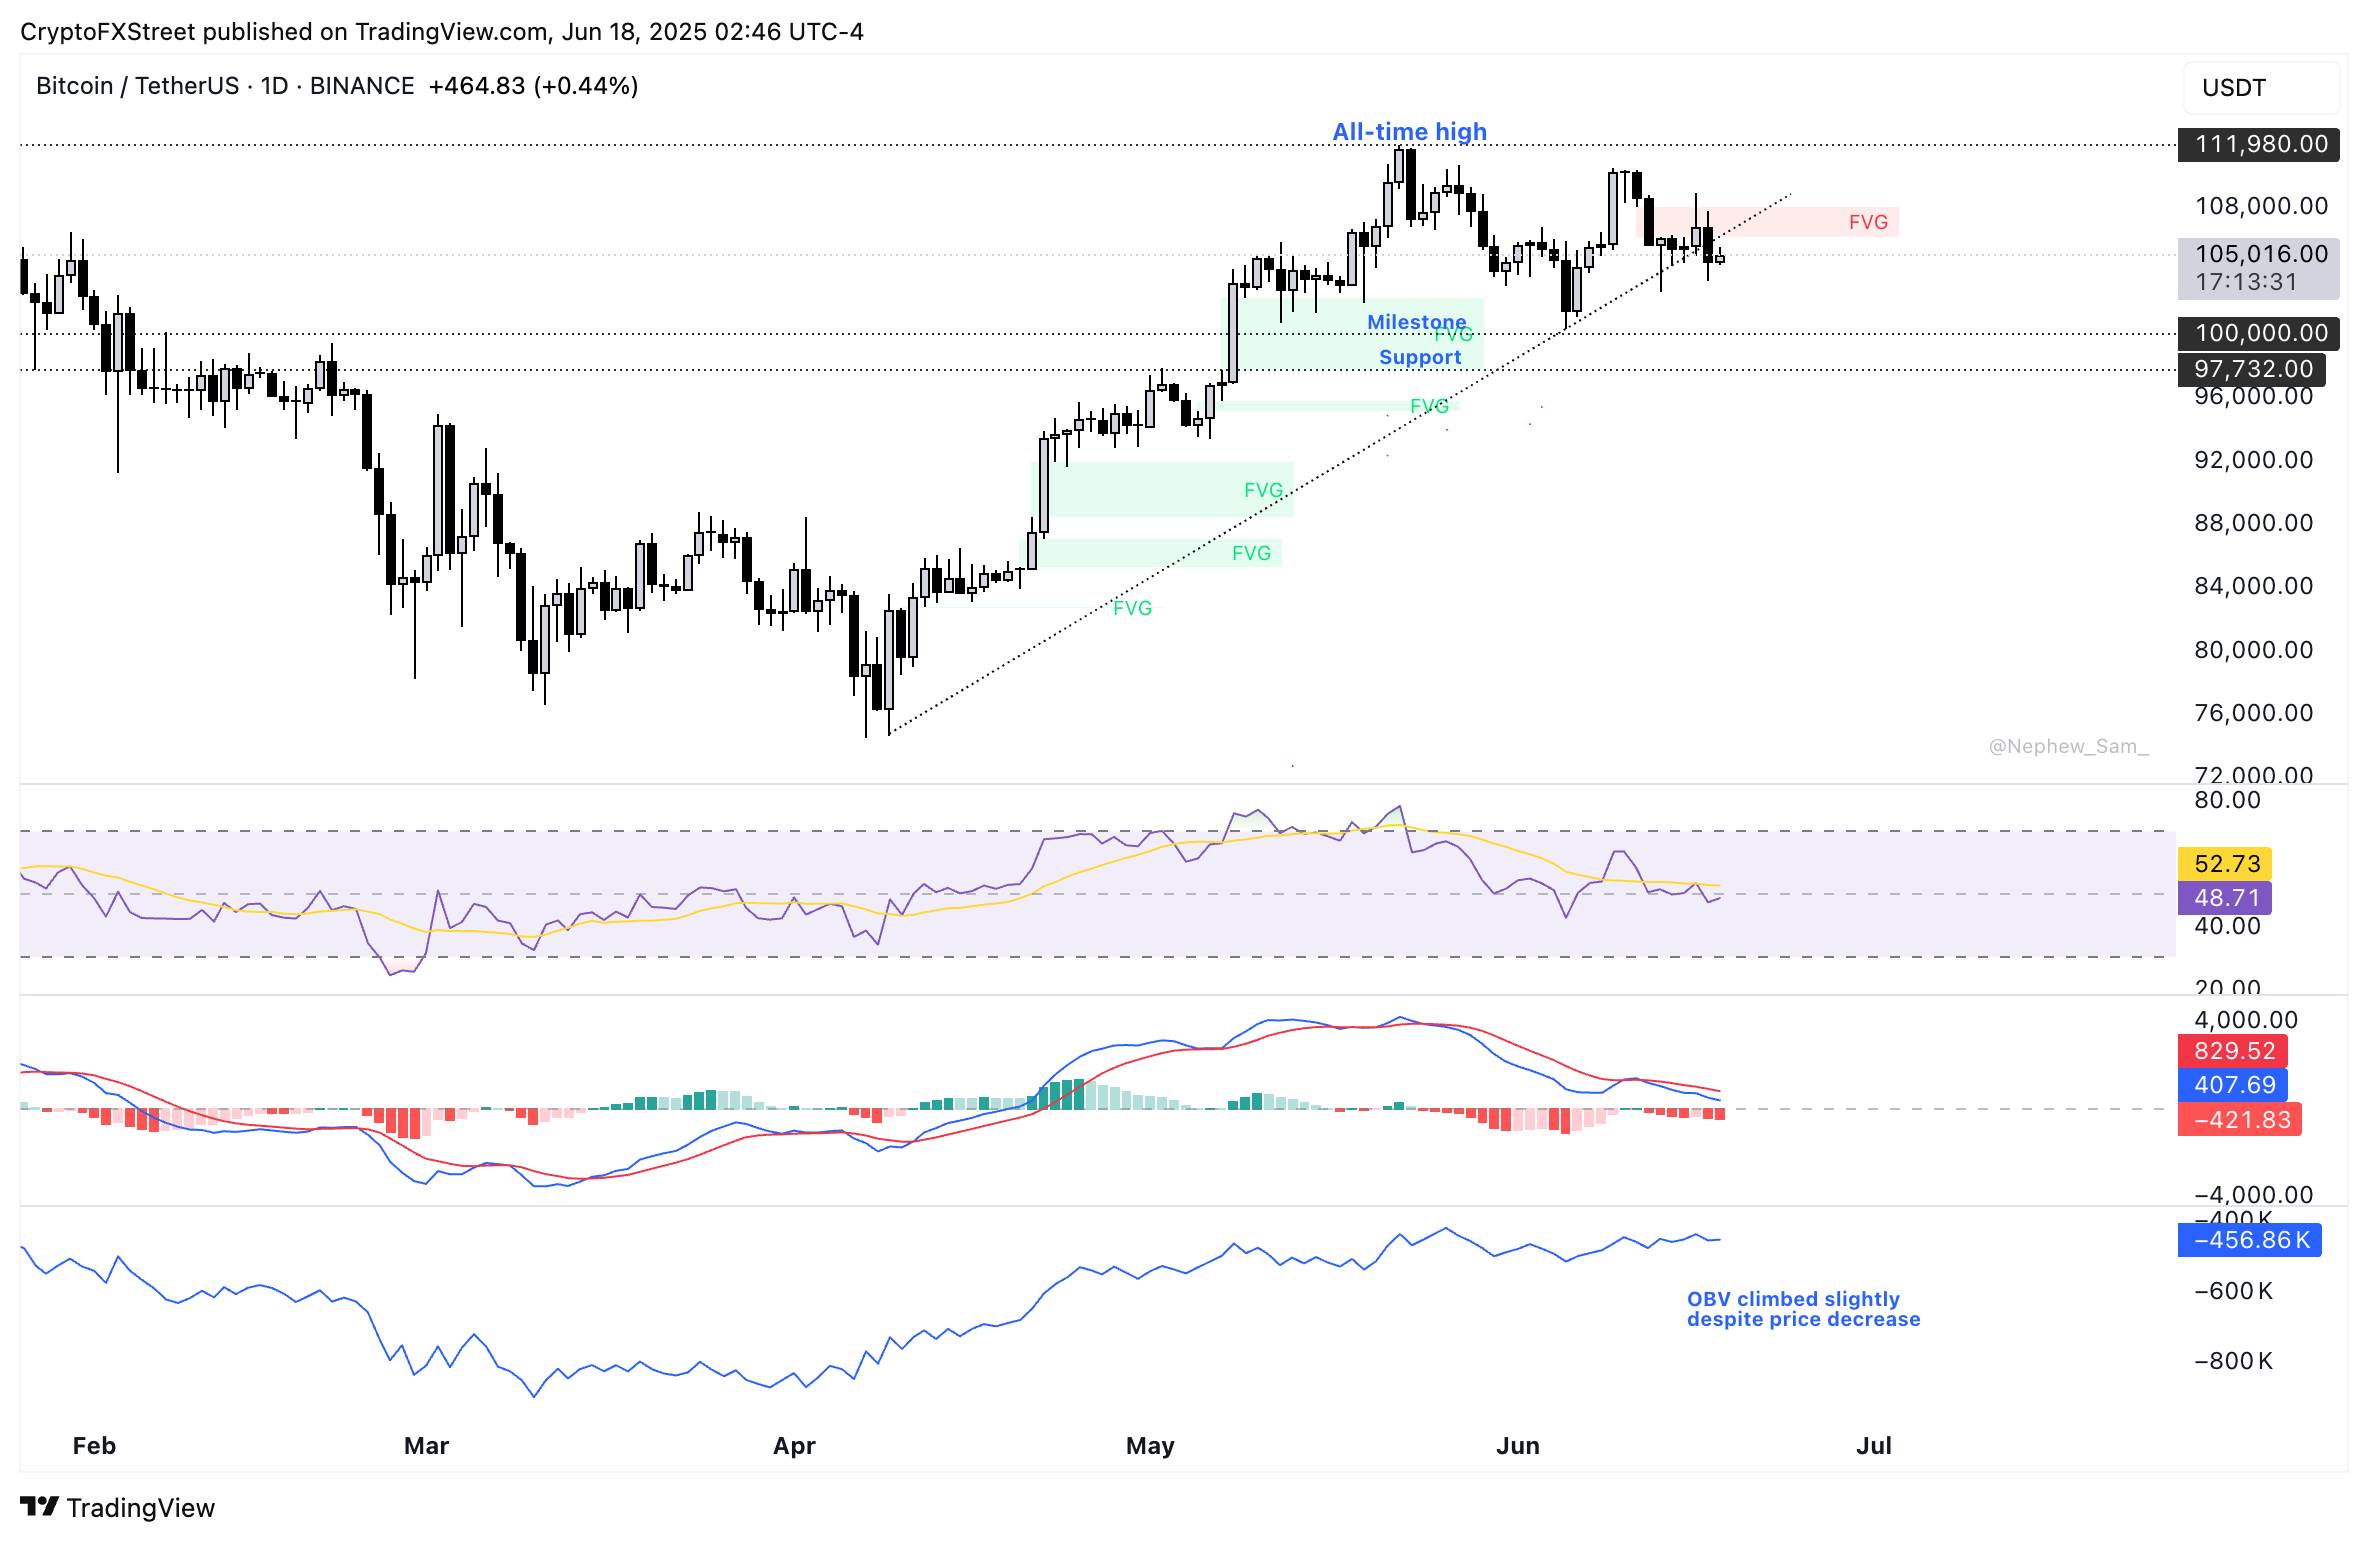
Bitcoin price eyes breakout from consolidation
Bitcoin is currently consolidating near to support at $103,000. On-Balance Volume (OBV) technical indicator shows divergence with price on the daily timeframe, suggesting that it is likely that the Bitcoin price trend reverses.
The Relative Strength Index (RSI) reads 48, consolidating around the neutral level of 50 and suggesting indecision among traders. However, the Moving Average Convergence Divergence (MACD) indicator shows red histogram bars below the neutral line, indicating an underlying negative momentum in Bitcoin’s price trend.
Looking down, BTC could sweep liquidity at the Friday low of $102,664.
BTC/USDT daily price chart | Source: TradingView
In case of a bullish breakout from the consolidation, Bitcoin could attempt a re-test of the all-time high at $111,980, after breaking past resistance at the lower and upper boundaries of the Fair Value Gap (FVG) on the BTC/USDT daily price chart at $106,179 and $108,046, respectively.
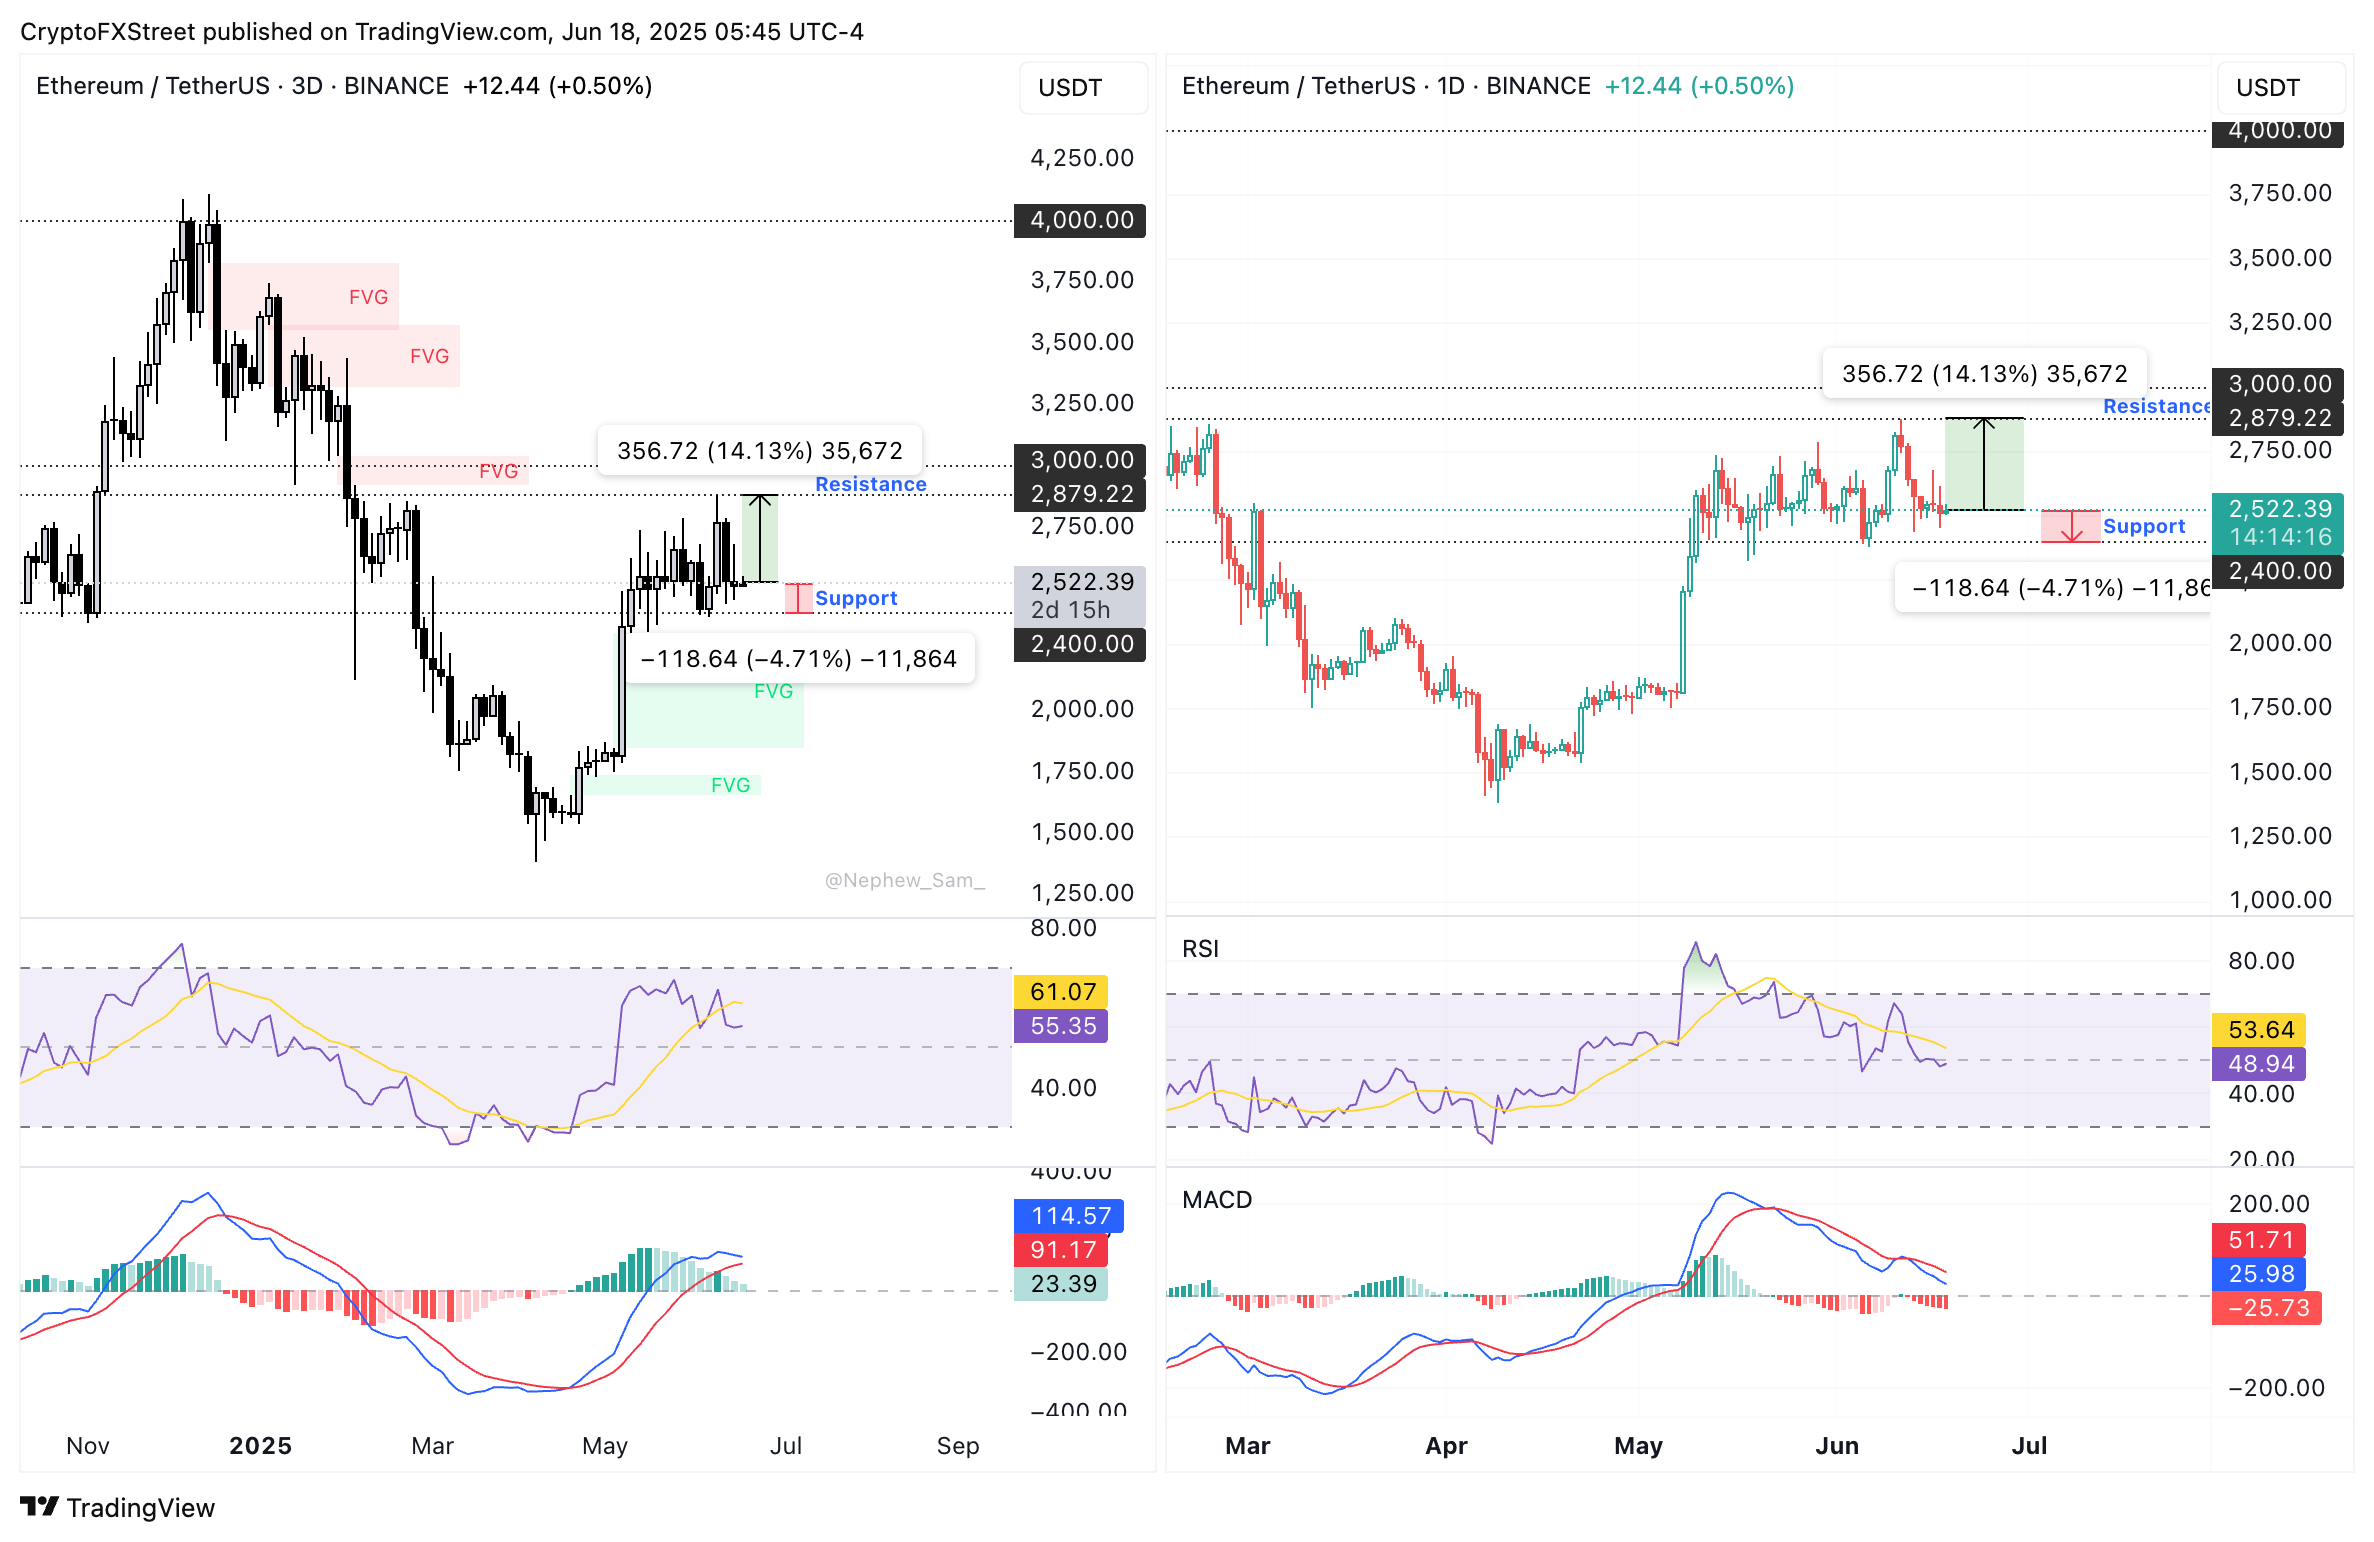
Ethereum price sees signs of recovery
Ethereum is less than 5% away from its support and the declining green histogram bars on the MACD indicator on the three-day chart suggest weakening bullish momentum.
However, ETH could see a daily candlestick close above resistance at $2,700 and test the psychologically important $3,000 level. Still, Ethereum faces interim resistance in the June 9 peak of $2,879.
The RSI indicator reads 55 on the 3-day chart, showing mild bullish momentum. Still, it holds around 48 after correcting from overbought conditions on the daily chart, suggesting that the bullish momentum has faded in the shorter term.
ETH/USDT daily and three-day price chart | Source: TradingView
Conversely, Ethereum could sweep liquidity at the $2,400 support, less than 5% below its current price.
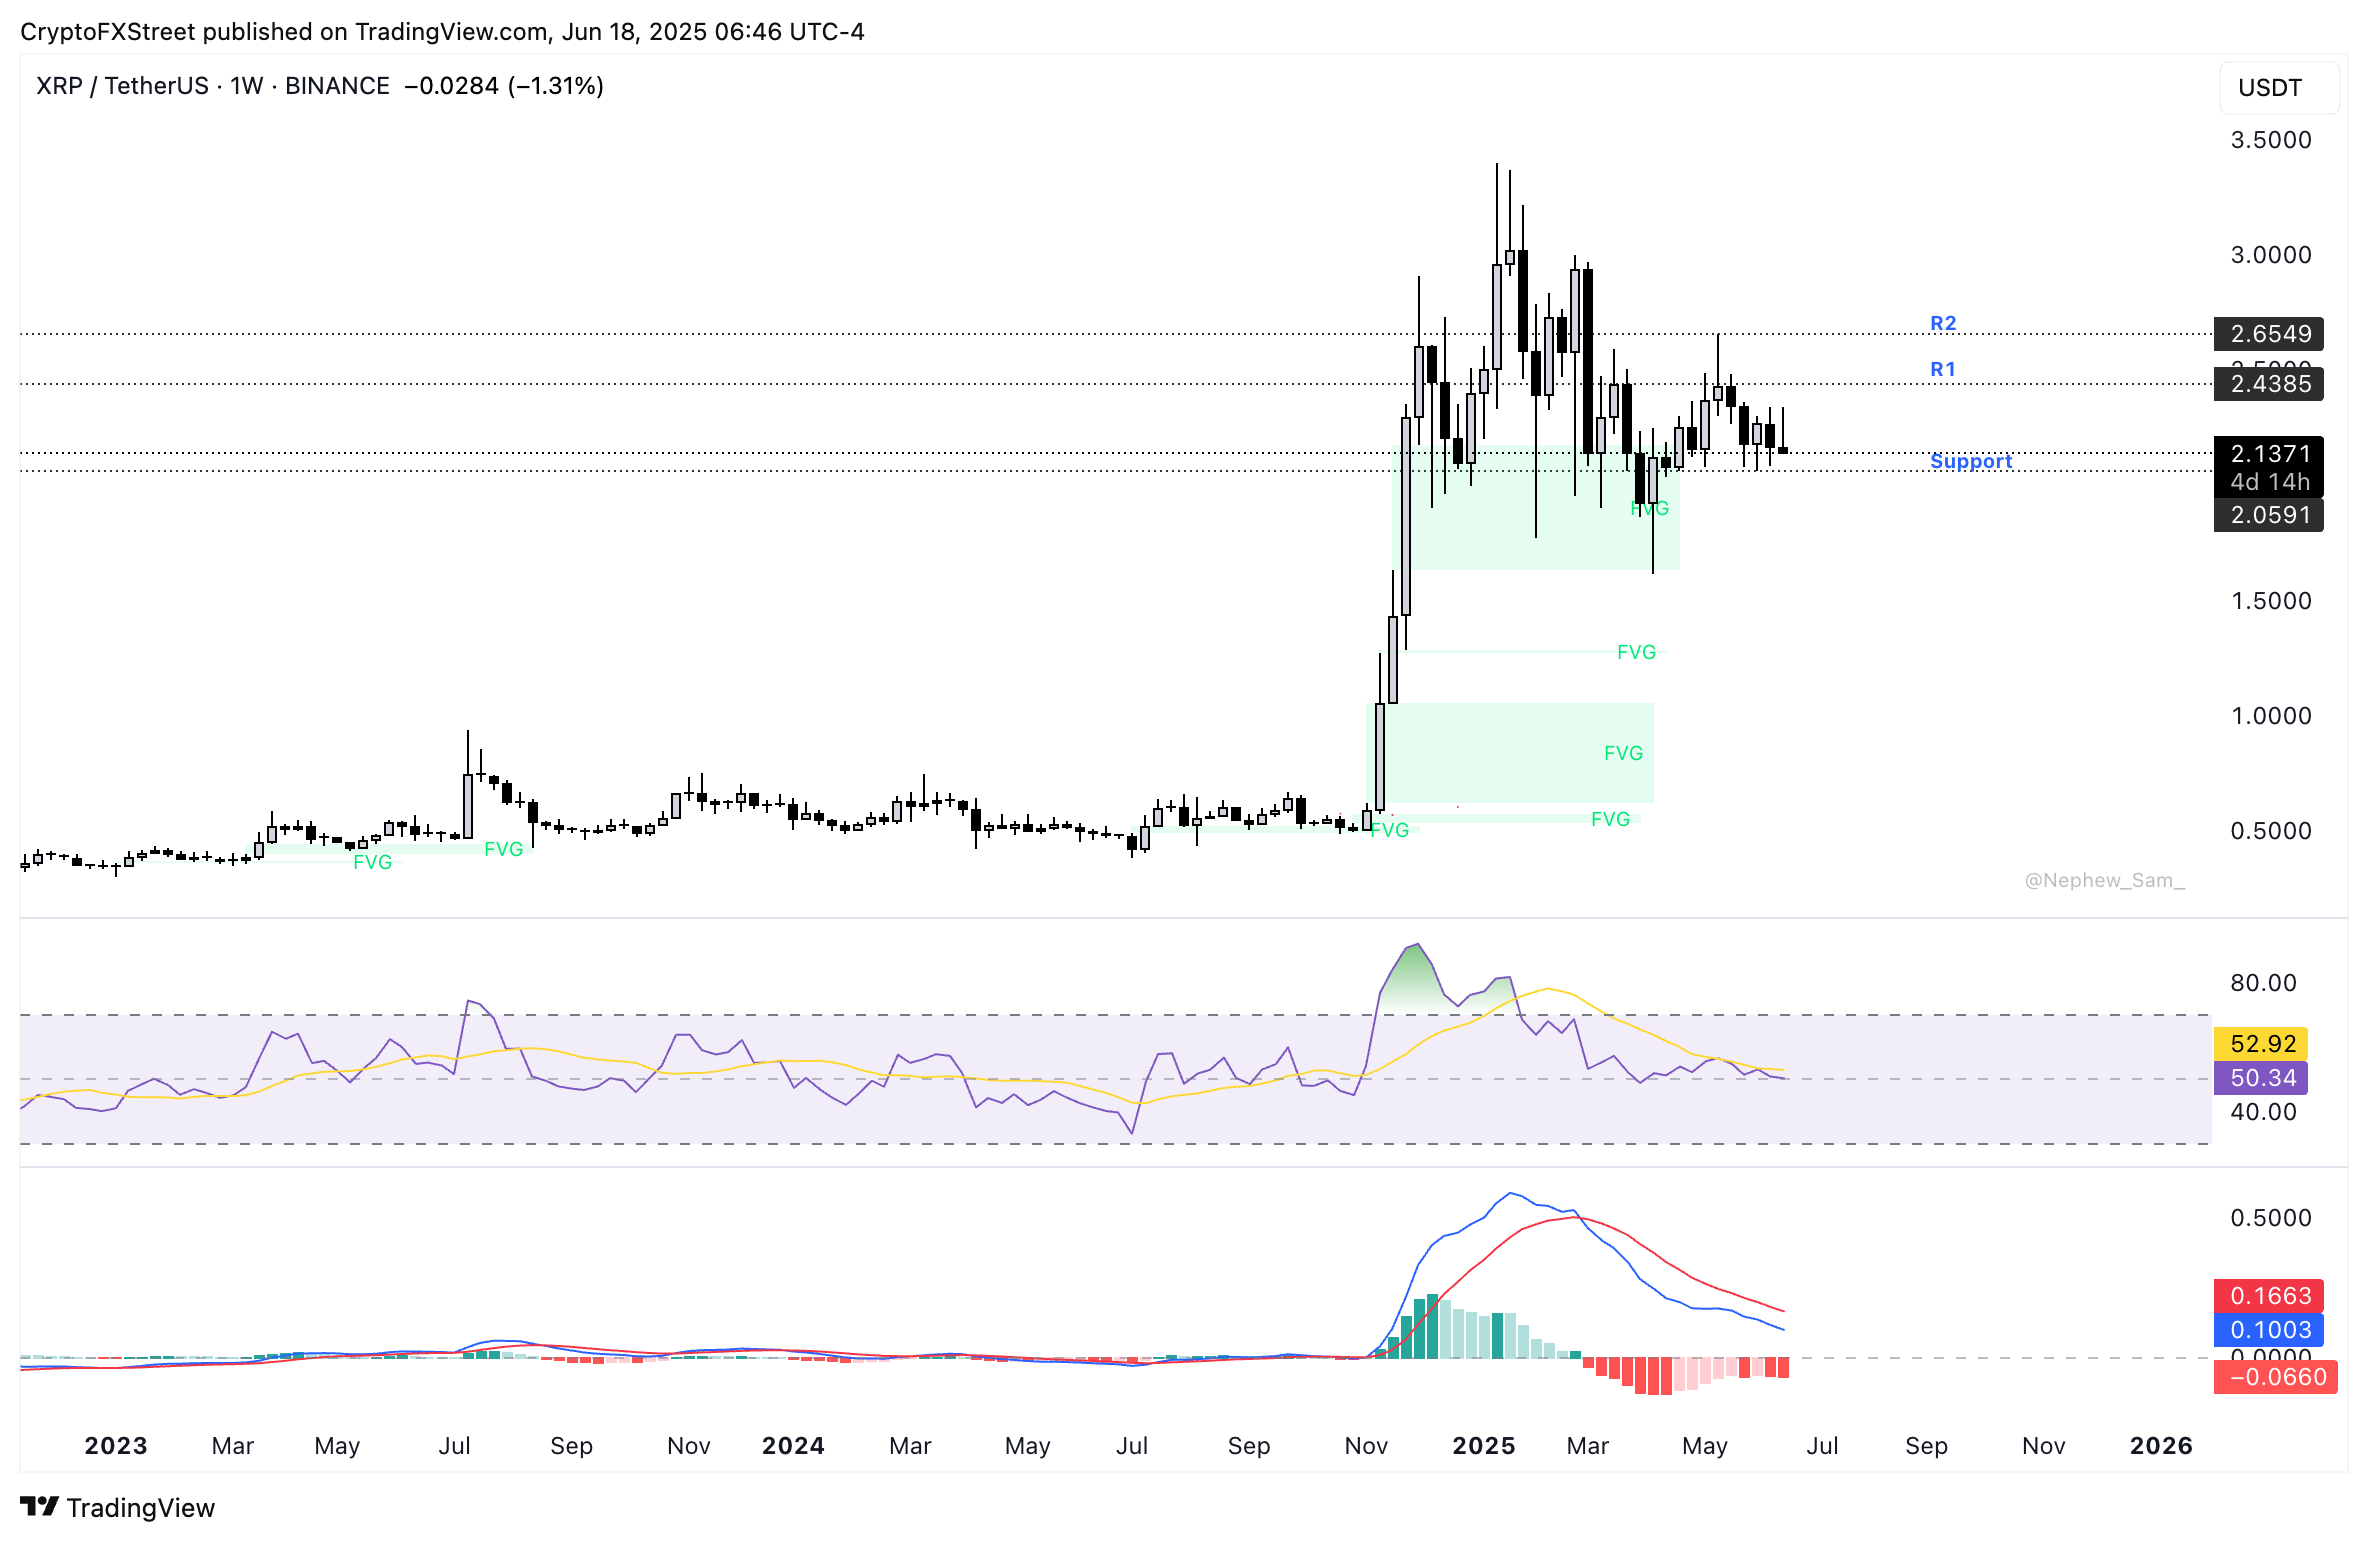
XRP defends key support
XRP is trading above support at $2.0591, as seen on the weekly price chart below. XRP faces two key resistances if it climbs higher, R1 at $2.4385 and R2 at $2.6549. The technical indicators on the weekly chart show mixed signals with RSI reading 50 and MACD flashing red histogram bars below the neutral line, signalling indecision among investors.
As long as the altcoin defends support, it could end the consolidation and begin a recovery. A daily candlestick close above $2.2648, a key resistance level, could push XRP higher, towards the two key resistances.
XRP/USDT weekly price chart | Source: TradingView
Conversely, a candlestick close under support at $2.0591 could send XRP to sweep liquidity at $2, a psychologically important level for the altcoin.
As the top three cryptocurrencies continue defending their support, Bitcoin has held steady above the $100,000 milestone and market participants are neutral. The Fear & Greed Index shows that there is a neutral sentiment, reading 52 on a scale from 0 to 100.

Fear & Greed Index | Source: Alternative.me
Sentiment has ranged between neutral and greedy for over a week, through the last six days of conflict in the Israel-Iran war. Geopolitical tensions have failed to dampen the mood among crypto traders, and Bitcoin ETF flows and price trends suggest the crypto market may have matured, compared to previous cycles.
Fineqia Senior Analyst Matteo Greco told FXStreet,
“On-chain data shows that long-term holders (LTH) of BTC remain relatively inactive, suggesting limited selling pressure at current levels. Historically, LTHs tend to increase selling during market peaks, and their current restraint may indicate expectations for higher prices before significant profit-taking begins.
This positioning could pave the way for BTC to reach new highs in Q3 or Q4, following patterns seen in previous bull market cycles. Historically, such peaks have preceded a shift in capital towards altcoins during the final leg of upward trends.”
Author

Ekta Mourya
FXStreet
Ekta Mourya has extensive experience in fundamental and on-chain analysis, particularly focused on impact of macroeconomics and central bank policies on cryptocurrencies.


