Bitcoin Elliott Wave technical analysis [Video]
![Bitcoin Elliott Wave technical analysis [Video]](https://editorial.fxstreet.com/images/Markets/Currencies/Digital Currencies/Bitcoin/Bitcoin_1_XtraLarge.jpg)
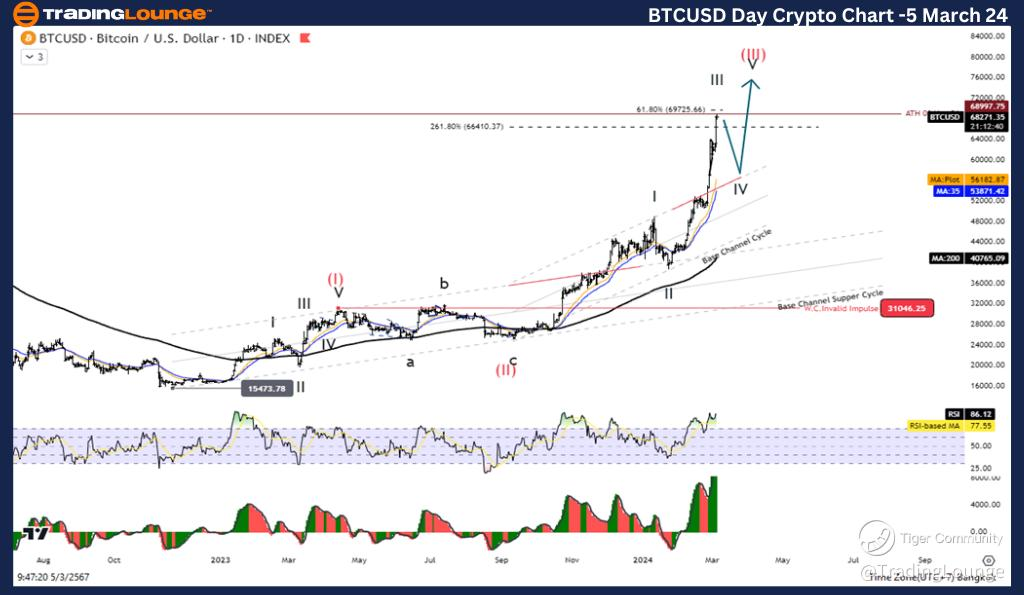
BTC/USD Elliott Wave technical analysis
Function: Follow Trend.
Mode: Motive.
Structure: Impulse.
Position: Wave III.
Direction next higher degrees: Wave (III).
Wave cancel invalid level: 31046.25.
Details: The five-wave increase in wave (III) may be complete Watch out for Corrective
BTC/USD trading strategy
Bitcoin's rise continues higher From the rise of the third wave This is likely to break the all time high of 68997.75, but in the final stretch of the rally we still lack movement. Two more times to complete the large Impulse structure, watch out for corrections.
Bitcoin/ U.S. dollar(BTCUSD)Technical Indicators: The price is above the MA200 indicating an Uptrend, Wave Oscillator is a bullish Momentum.
BTC/USD daily chart
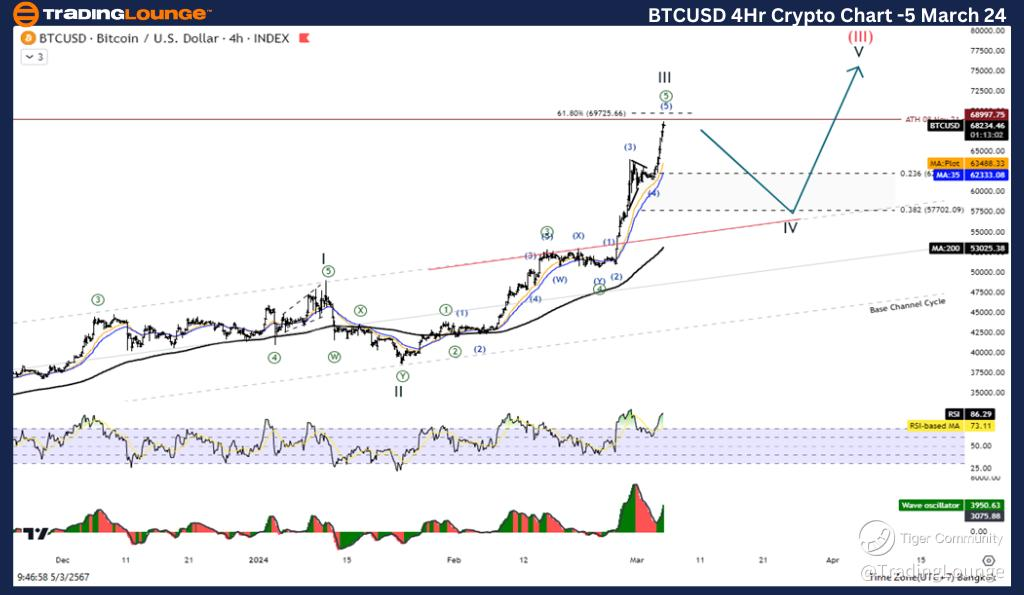
BTC/USD Elliott Wave technical analysis
Function: Follow Trend.
Mode: Motive.
Structure: Impulse.
Position: Wave III.
Direction next higher degrees: Wave (III).
Wave cancel invalid level: 31046.25.
Details: The five-wave increase in wave (III) may be complete Watch out for Corrective.
BTC/USD trading strategy
Bitcoin's rise continues higher From the rise of the third wave This is likely to break the all time high of 68997.75, but in the final stretch of the rally we still lack movement. Two more times to complete the large Impulse structure, watch out for corrections.
Bitcoin/ U.S. dollar (BTCUSD)Technical Indicators: The price is above the MA200 indicating an Uptrend, Wave Oscillator is a bullish Momentum.
BTC/USD four hour chart
BTC/USD Elliott Wave technical analysis [Video]
Author

Peter Mathers
TradingLounge
Peter Mathers started actively trading in 1982. He began his career at Hoei and Shoin, a Japanese futures trading company.


