Bitcoin drops $3,000 in few hours but bullish outlook valid
-
Traders are probably grabbing profits at the resistance. But is the BTC/USD uptrend over? Or is the decline just part of a retracement?
-
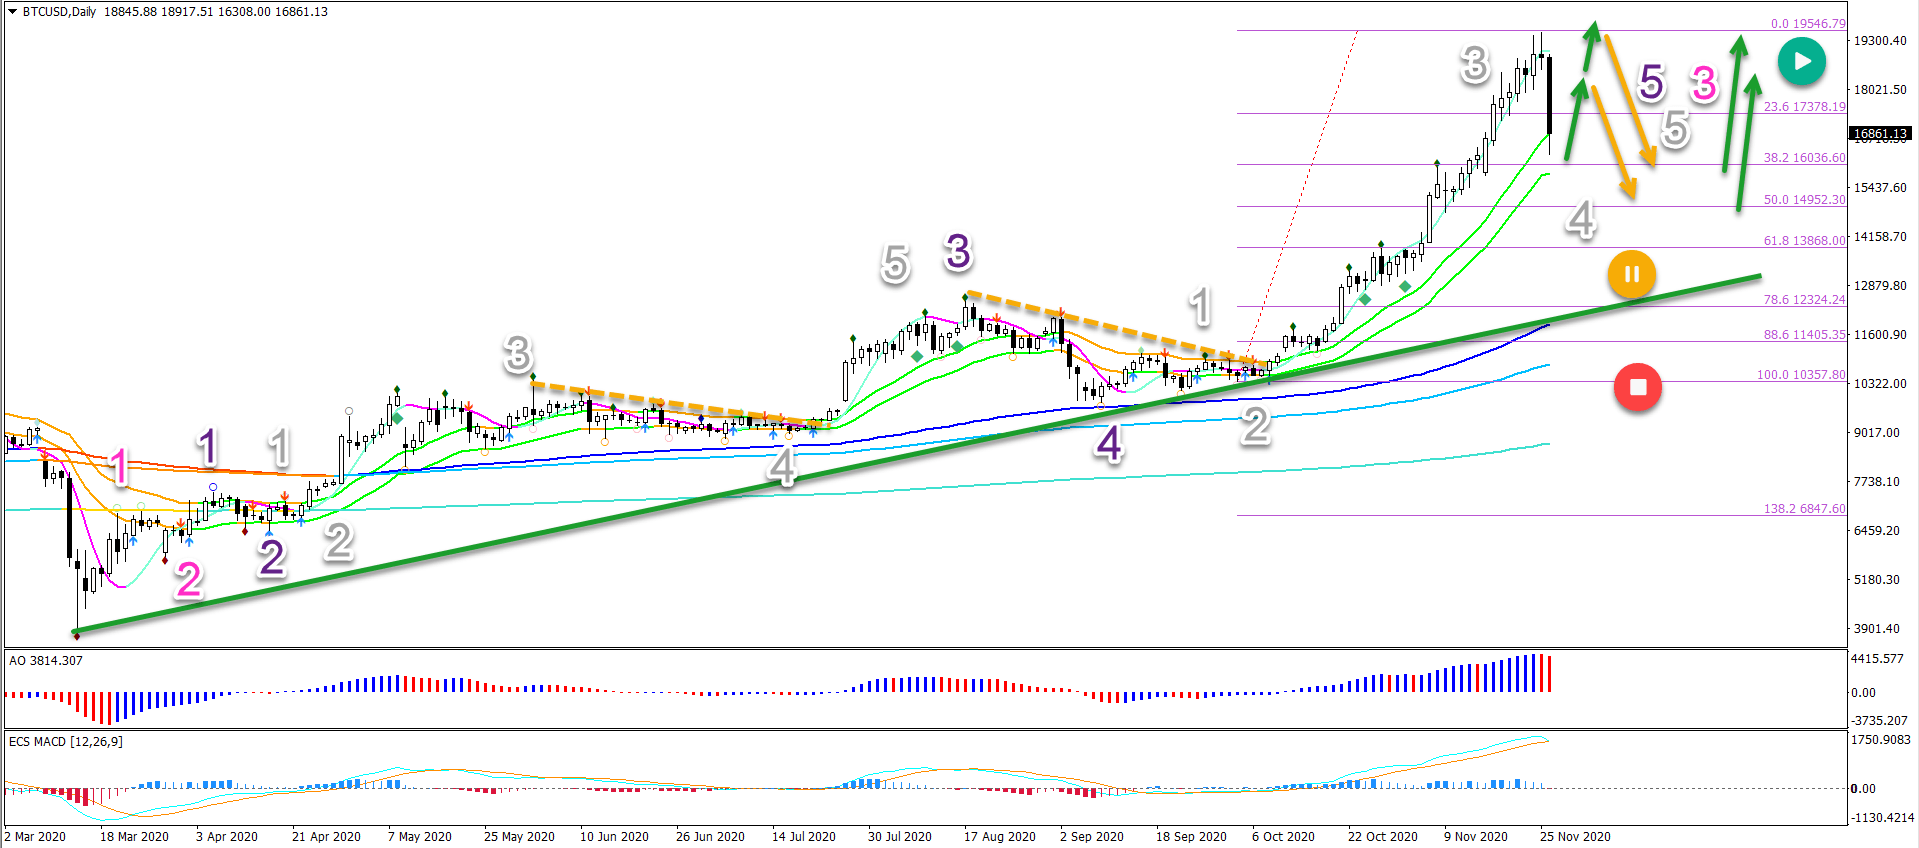
BTC/USD decline is probably completing a wave 3. Which means that the current retracement is expected to be a retracement. And that means: more uptrend.

Price Charts and Technical Analysis
That said, waves 4 are usually choppy, corrective and lengthy. A bull flag pattern or triangle pattern is typical. If this pattern does emerge, then an uptrend is very likely.
What if price action keeps falling? It would need to break below the 50-61.8%% Fibonacci retracement level before an immediate uptrend becomes unlikely (orange circle). A break below the long-term moving averages indicates a change of trend (red circle).
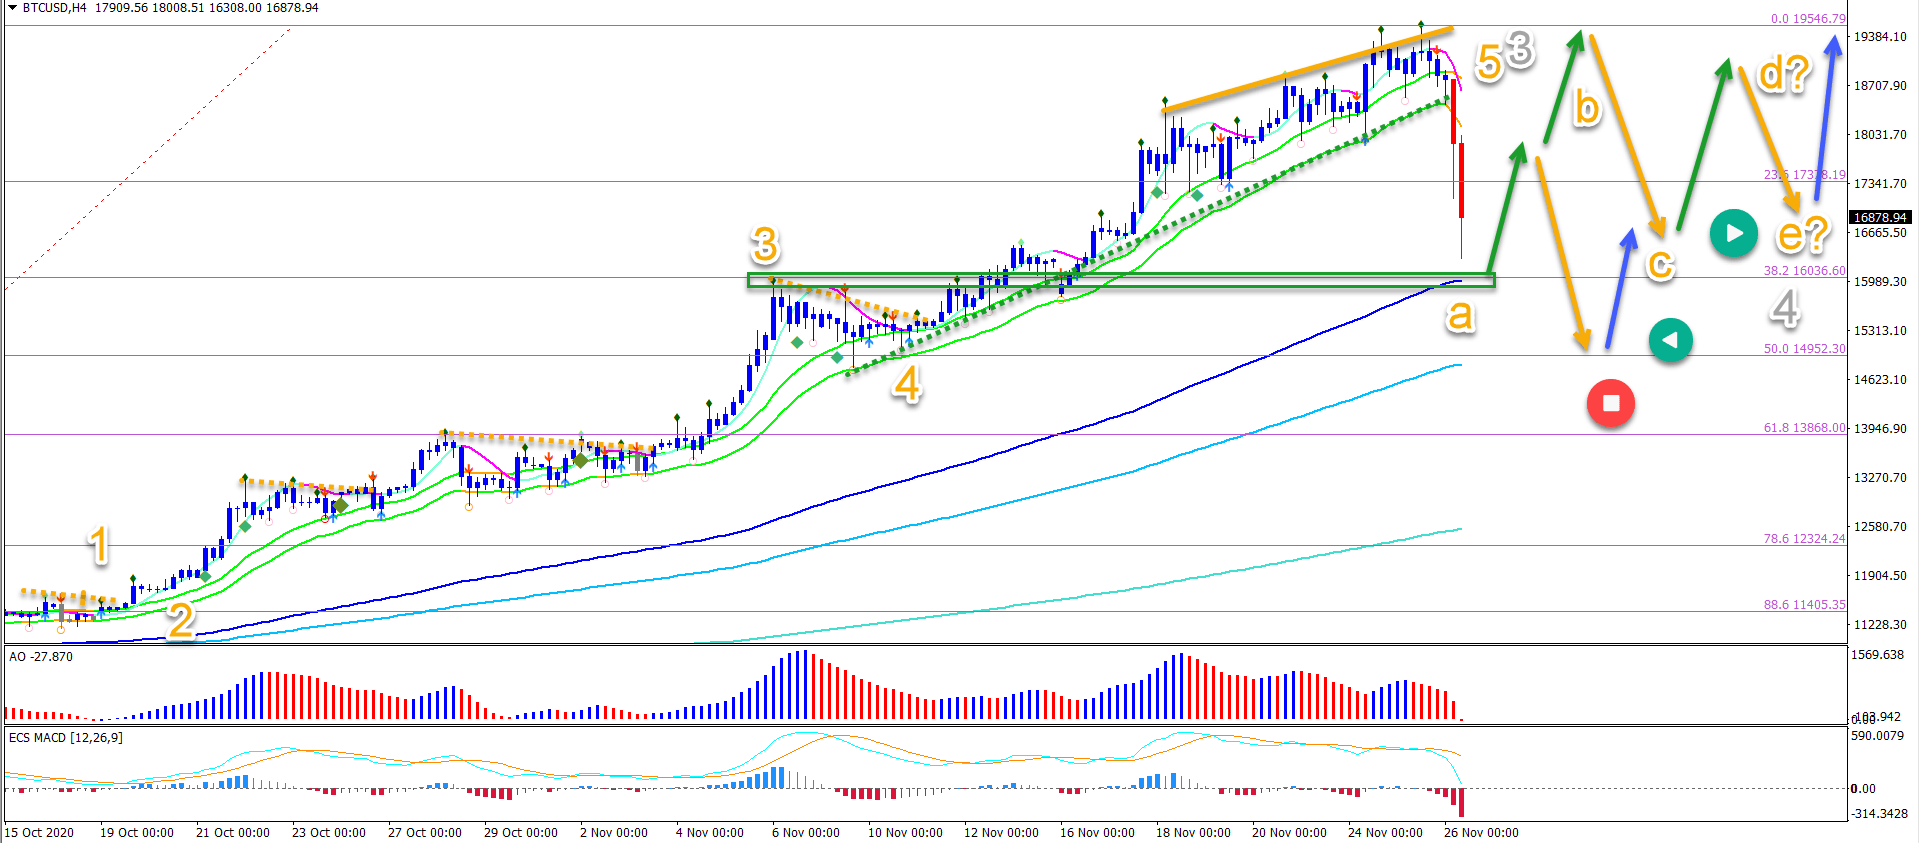
On the 4 hour chart, you can see the $3,000 drop that occurred earlier this week. The decline is showing strong momentum (red candles). But price action could easily bounce at the 38.2% Fibonacci level.
If it does, the main question will be: how far does price move up?
-
A retest of the previous top indicates potential triangle chart pattern.
-
A shallower bullish pullback could indicate a bearish zigzag pattern instead.
Once the pattern is complete, an uptrend (blue arrows) is expected unless price breaks below the 50% Fib support zone. In that case, hang on for more volatility (red circle).
The analysis has been done with the ecs.SWAT method and ebook.
Author

Chris Svorcik
Elite CurrenSea
Experience Chris Svorcik has co-founded Elite CurrenSea in 2014 together with Nenad Kerkez, aka Tarantula FX. Chris is a technical analyst, wave analyst, trader, writer, educator, webinar speaker, and seminar speaker of the financial markets.


