Bitcoin dominance rises to 51.2% for the 1st time in 2018: Bitcoin price uptrend stalls below $6,500
- Rising Bitcoin dominance reassures investors of a potential bull run towards the end of 2018.
- The buyers must keep the above $6,450 in the short-term to avoid further breakdown towards $6,400.

Bitcoin price market dominance rate continues to rise in spite of the bear pressure in the market. The bears have a tight grip on the market since August started and the current price range is not pleasing most of the investors. Experts like Fundstrat’s Thomas Lee have predicted a bull rally towards the end of the year which will see BTC/USD trade above $20,000. However, the crumbling prices are making this predictions fade bit by bit.
Let us put that aside for now. Bitcoin price dominance in the cryptocurrency market has hit 51.2% according to CoinMarketCap. This is the highs Bitcoin has reached in 2018, which also means that over 50% of the total crypto market capitalization is in BTC. Similarly, the rise in dominance was witnessed towards the end of last year leading to the biggest boom in the market. While the dynamics have changed since December 2017, the rise shows that there is indeed hope for the king of digital assets to retrace towards $20,000 after all.
Bitcoin price analysis
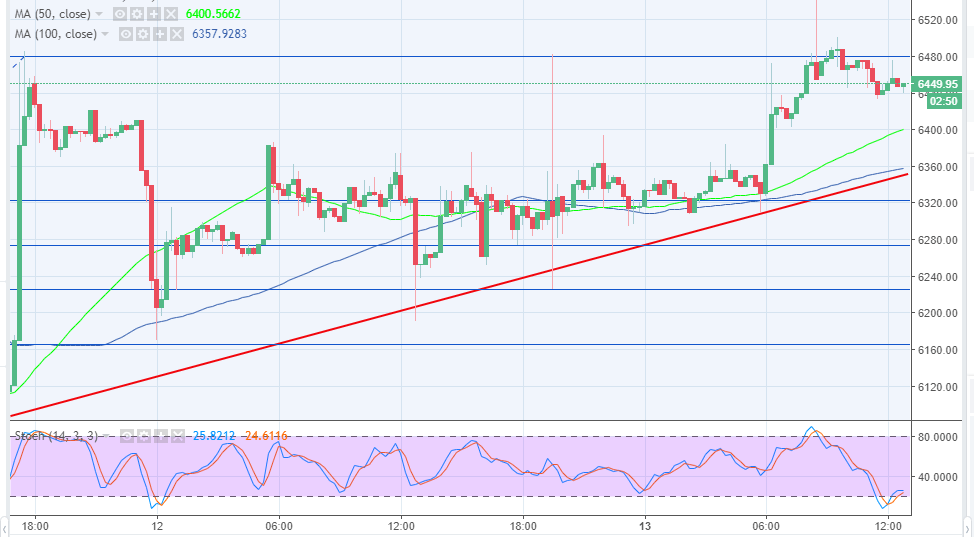
Bitcoin price brushed shoulders with $6,500 after the analysis I published 3 hours ago. However, on failure to break above the resistance at the level, the trend turned bearish. BTC/USD broke below the short-term support that had been formed at $6,475. The price is currently testing the next support zone at $6,440. Besides, the trend has turned bearish as the stochastic dips into the oversold levels.
There is another weak support at $6,425, but significant support will be found at $6,400. The buyers must keep the above $6,440 support in the short-term to avoid further breakdown towards $6,400. On the upside, eyes are locked at $6,500 and a break above this level is likely to open a door for more upside movement towards $6,600 significant resistance.
BTC/USD 15-minutes chart
Author

John Isige
FXStreet
John Isige is a seasoned cryptocurrency journalist and markets analyst committed to delivering high-quality, actionable insights tailored to traders, investors, and crypto enthusiasts. He enjoys deep dives into emerging Web3 tren


