Bitcoin chart is echoing the 1970s soybean bubble: Peter Brandt

Bitcoin’s price chart has started to show similarities to the soybean market around 50 years ago, which saw prices top before plummeting 50% as global supply began to outweigh demand, warns veteran trader Peter Brandt.
However, other Bitcoin analysts are confident that the charts are signaling further upside ahead.
“Bitcoin is forming a rare broadening top on the charts. This pattern is famous for tops,” Brandt told Cointelegraph.
“In the 1970s, Soybeans formed such a top, then declined 50% in value,” Brandt said.
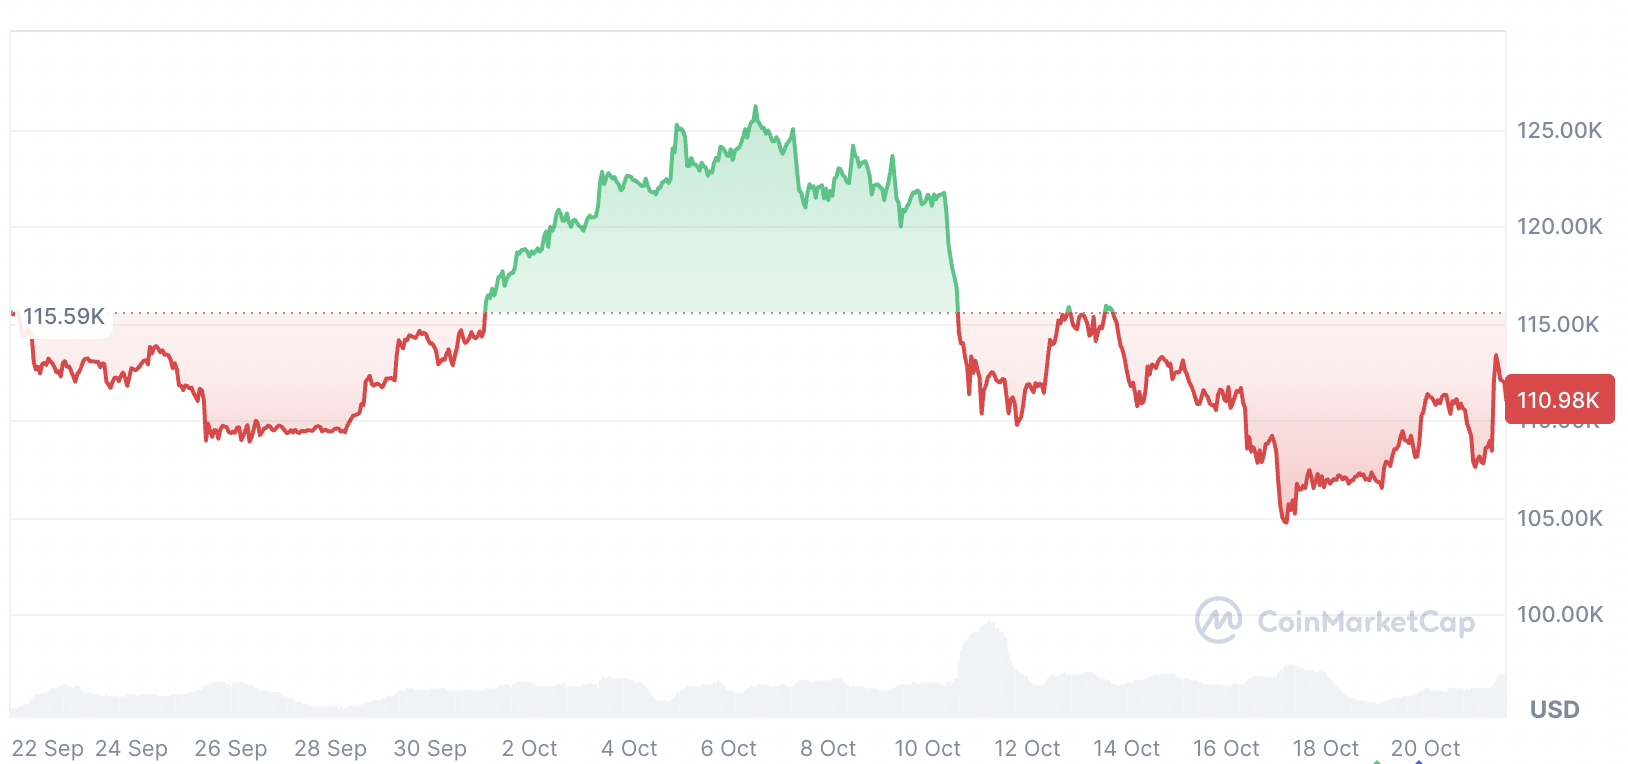
Bitcoin is down 5.32% over the past 30 days. Source: CoinMarketCap
Brandt warned that if history repeats, it won’t just affect Bitcoin, it will also leave Michael Saylor’s company Strategy “underwater.”
Strategy’s (MSTR) stock price is down 10.13% over the past 30 days amid corporate Bitcoin treasuries facing mounting pressure from a sharp drop in net asset values (NAV).
Bitcoin’s “final thrust” may not come, Peter Brandt says
Brandt further warned that the big Bitcoin pump the crypto community has been waiting for may never come to pass, and that instead, Bitcoin could head to bear levels as low as $60,000.
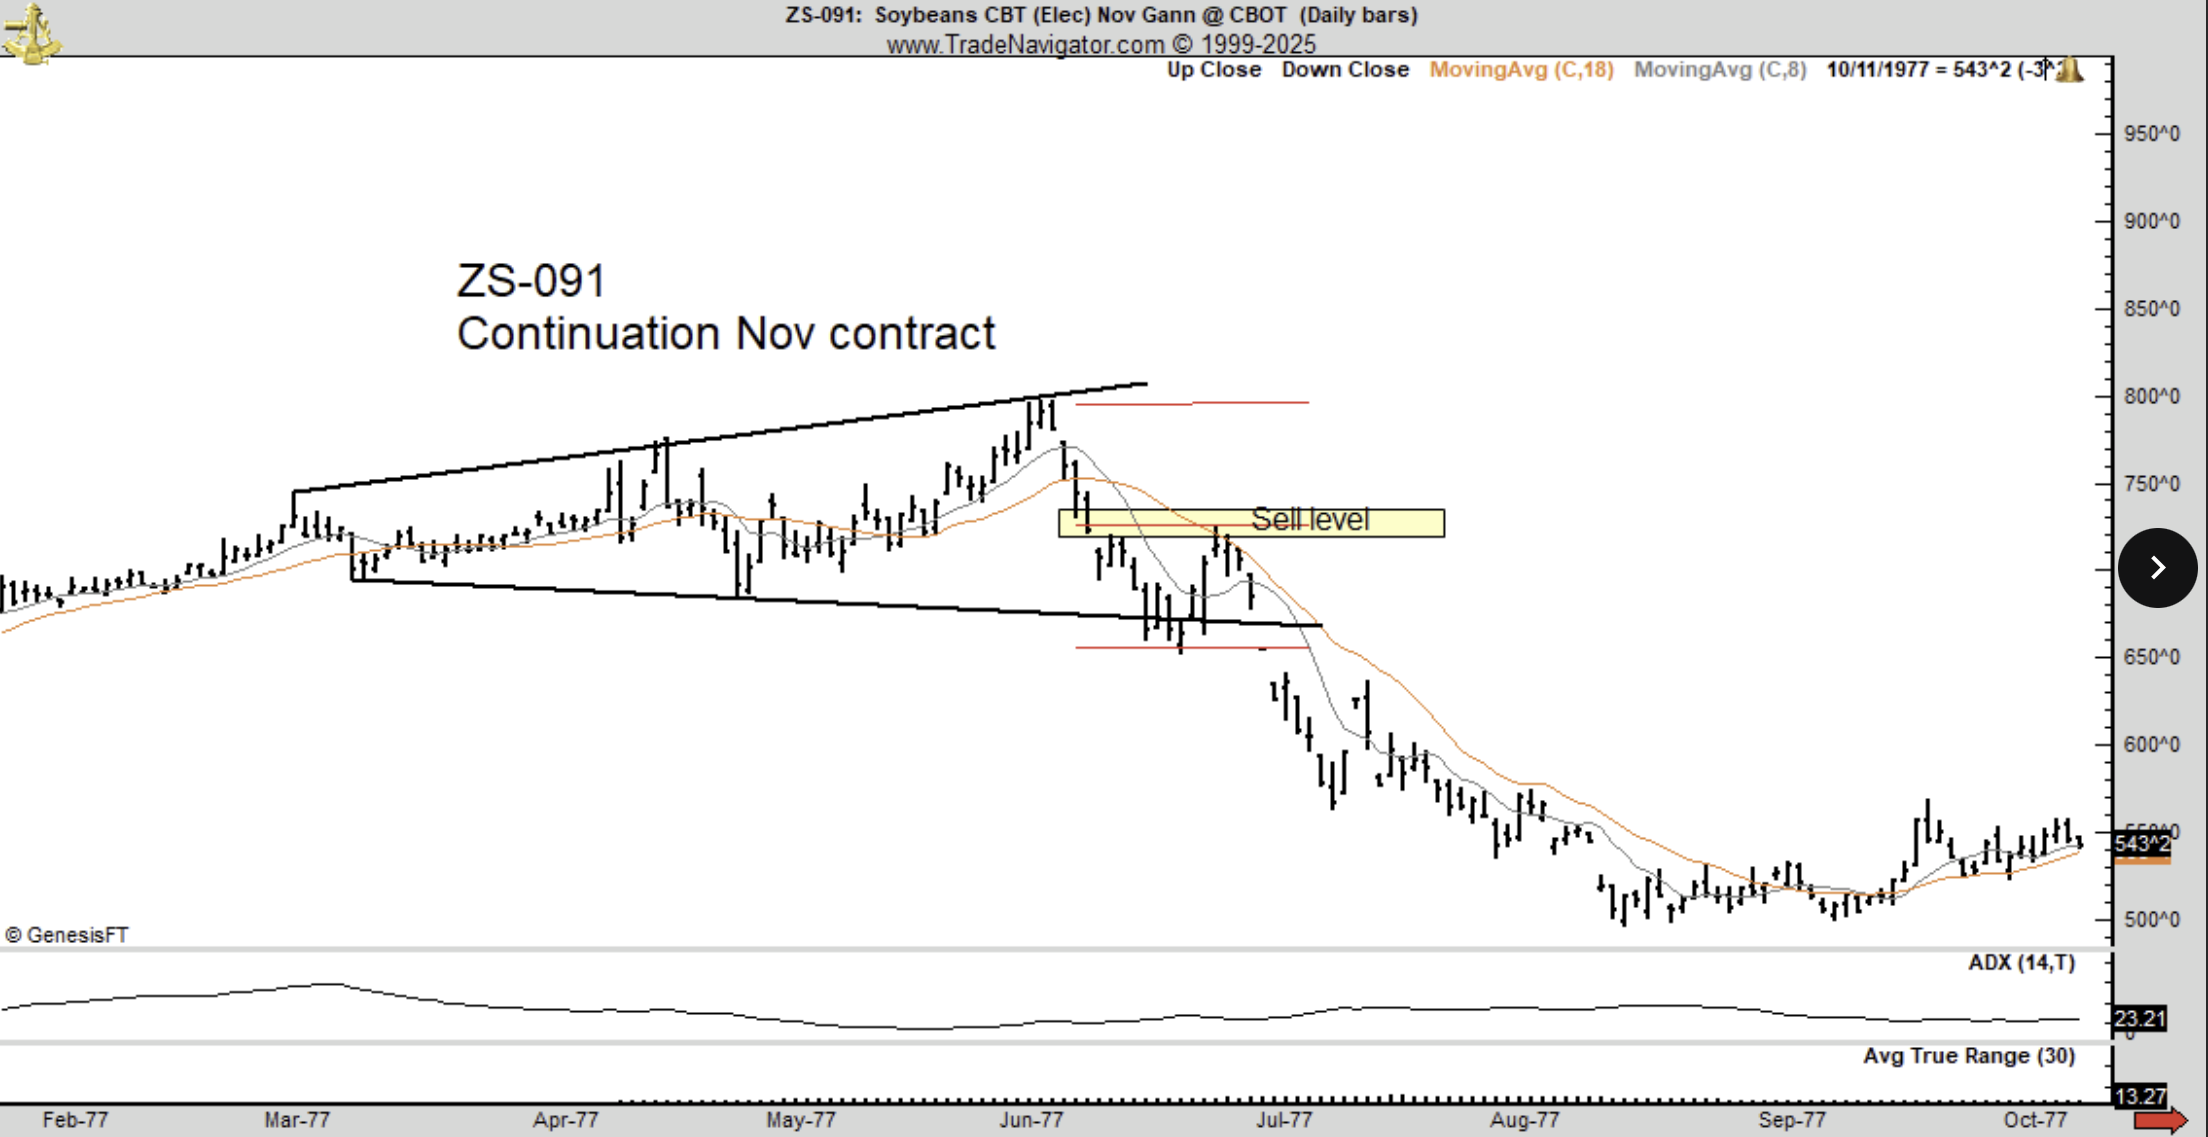
Peter Brandt uses the soybean chart in 1977 to point out similarities with Bitcoin’s current price chart. Source: Peter Brandt
Most analysts, however, believe Bitcoin still has one major rally left in this cycle, a move that could push Bitcoin’s price as high as $250,000, according to industry participants such as BitMEX co-founder Arthur Hayes.
The fourth quarter is historically Bitcoin’s strongest quarter, with an average return of 78.49%, according to CoinGlass.
October is also seen as a strong month for Bitcoin.
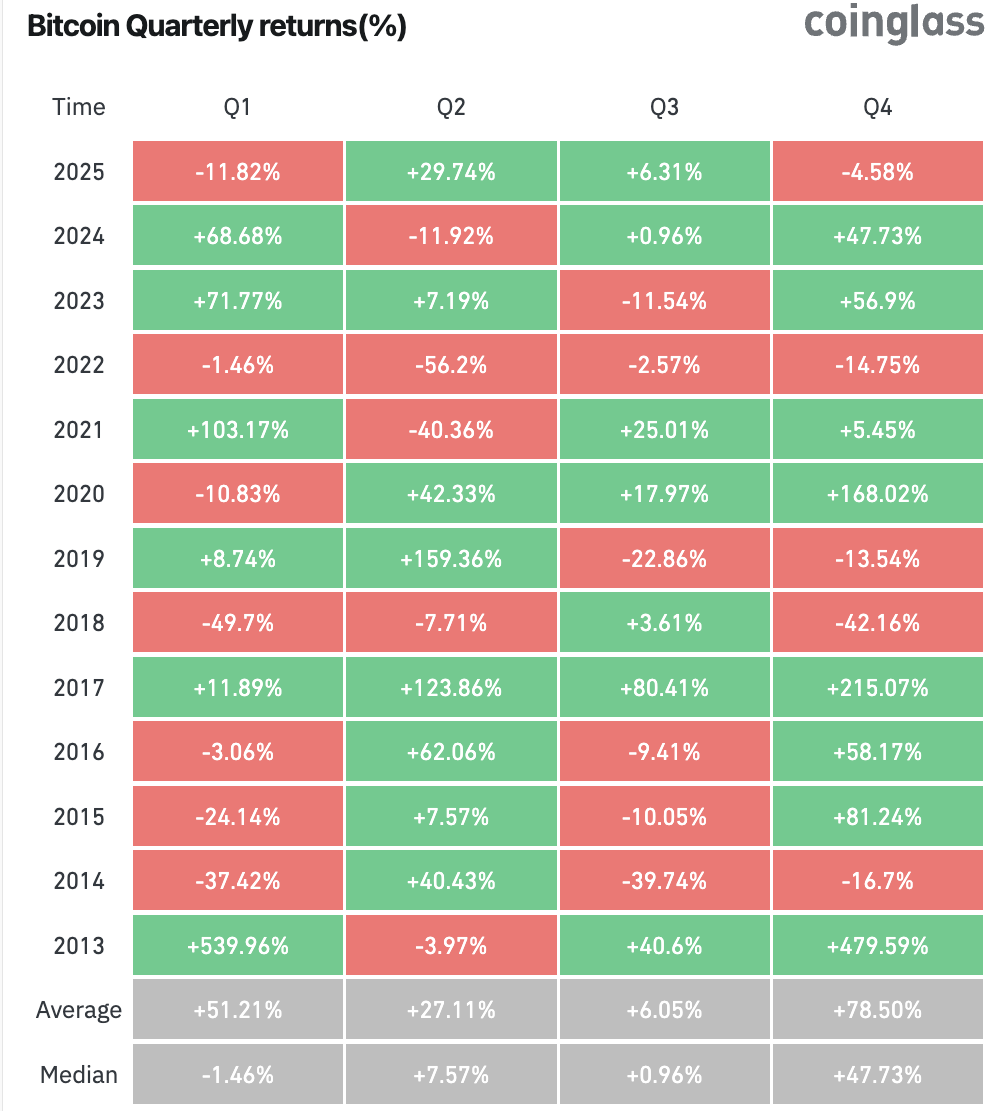
Q4 is historically the most bullish quarter for crypto. Source: CoinGlass
However, sentiment has entered a downtrend after US President Donald Trump’s recent tariff scare triggered a broader market downturn following record highs, leaving analysts more cautious.
Crypto sentiment falls to “Extreme Fear”
In what is supposed to be a bullish month for crypto, The Crypto Fear & Greed Index posted an “Extreme Fear” score of 25 in its Wednesday update.
Bitcoin “really needs to hold here, keeping the recent higher lows in tack and have another attempt at the monthly open where it was rejected yesterday,” said trading account AlphaBTC on X.
However, not all analysts are as bearish.
21Shares crypto investment specialist David Hernandez said Bitcoin’s “opportunity window” may open up quickly again for potential upward price movement if the US Consumer Price Index (CPI) shows any signs of relief or the “continuation of the immaculate disinflation narrative,” adding:
"Bitcoin is coiled and ready to spring upward.”
Meanwhile, MN Trading Capital founder Michaël van de Poppe pointed to gold’s recent 5.5% drop from its highs as a sign that “the rotation” into Bitcoin and altcoins may be starting.
Author

Cointelegraph Team
Cointelegraph
We are privileged enough to work with the best and brightest in Bitcoin.


