Bitcoin Cash technical analysis: Market could open up for targets lower down
- Next few sessions are pivitol for Bitcoin Cash as we approach 255.
- The Volume Profile indicator shows that we are under the mean value area.
- There is more space to move on the downside for the relative strength indicator.

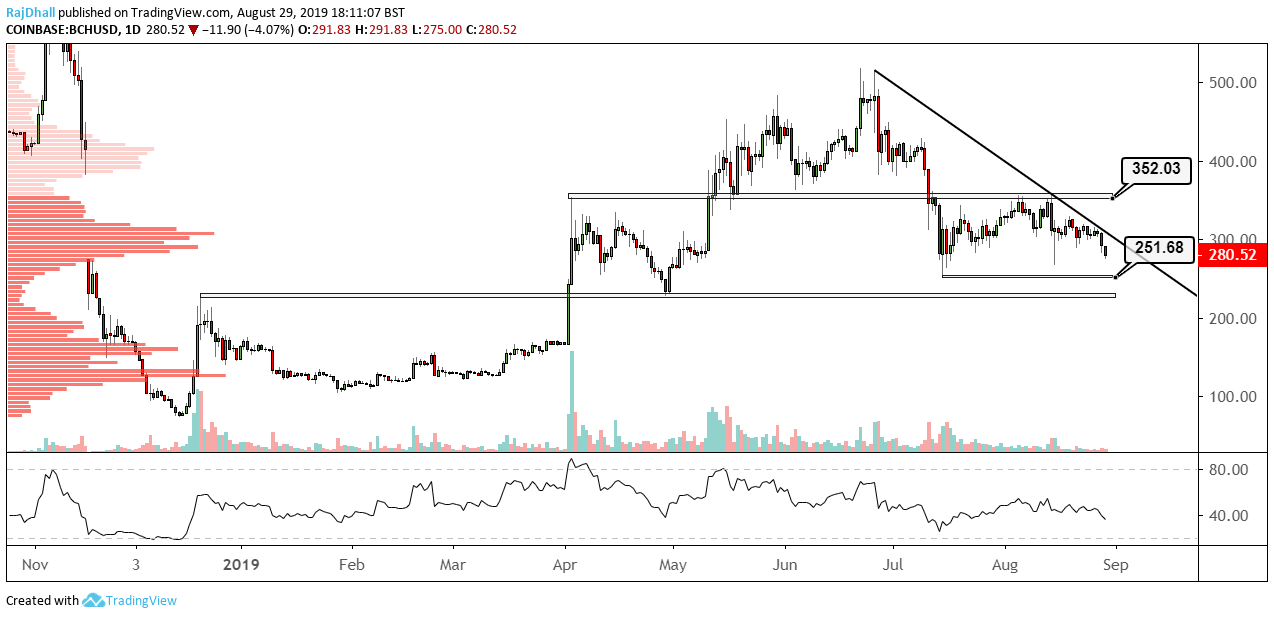
The daily chart above highlights the major levels to watch on the higher timeframe. Now 300 has been broken 251.68 seems to be the next major support zone to the massive 226 level.
From an indicator perspective, the RSI is now moving to lower levels but is still quite some way off the 20-30 oversold zone. The candlesticks are showing no real signs of a slow down in momentum and each red selling candle is bigger than the last on the daily timeframe, with volume also supporting the sell-side.
The Market Profile bell curve on the left-hand side of the chart is showing we have moved away from the mean distribution and 230 is now very important. If we see some momentum slowing down in the selling side we could move back. If not the next mean price hangs at the 156 zone.
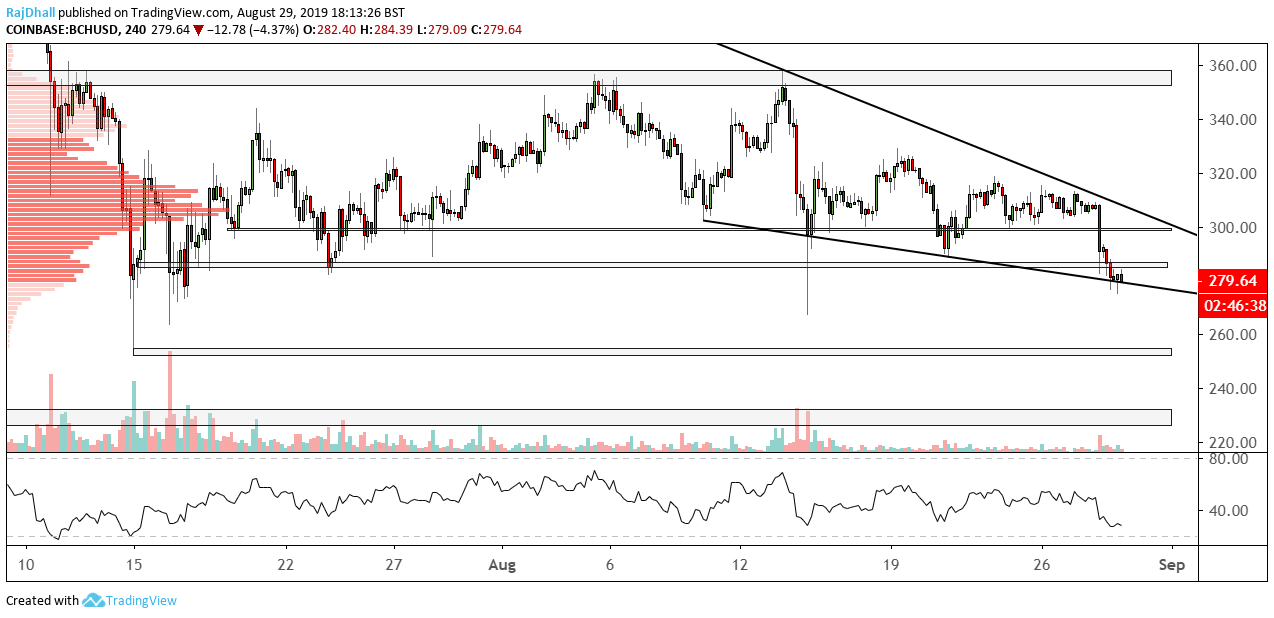
On the 4-hour chart below, the candles are showing that the bearishness has not stopped. The RSI is in a more extreme position but still has room to manoeuvre to the downside.
The selling candles still have more of a volume weighting to them but the recent rejection bullish hammer candle and a close above 282 on the next 4-hour candle will help the bulls with a change in sentiment but at the moment we are still moving lower.
The next few sessions are crucial as we would confirm a lower high and lower low if the 255 level breaks and today we are trading at 279.
Author

Rajan Dhall, MSTA
FX Daily
Rajan Dhall is an experienced market analyst, who has been trading professionally since 2007 managing various funds producing exceptional returns.


